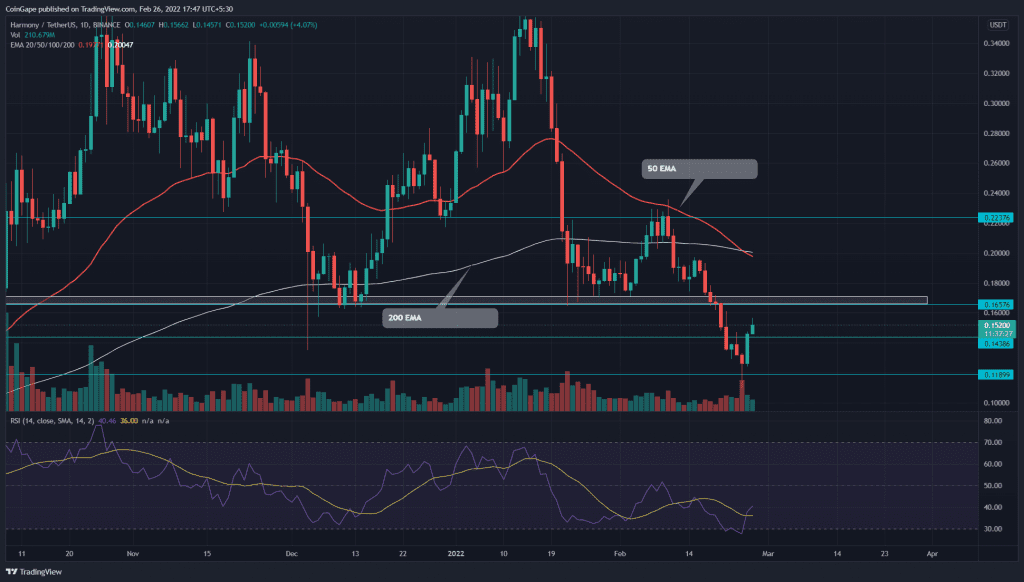
On February 10th, the Harmony (ONE) price turned down from the $0.223 resistance and lost 25% by hitting its $0.166 monthly support. The bulls had high hopes from the support, but the global markets facing geopolitical issues, i.e., Russia invading Ukraine, triggered further downfall and plunged the altcoin to $0.12 support. However, The coin chart shows a reversal opportunity at this support.
Key technical points:
- ONE price reclaims a minor resistance level of $0.143
- The technical chart shows a death crossover of the 50-and-200-day EMA
- The 24-hour trading volume in the Harmony coin is $238.1 Million, indicating a 20.3% gain.
Source-Tradingview
The ONE price breached the $0.165 crucial support on Feb 20th, intensifying the ongoing sell-off. The sellers pulled the altcoin to the September 2020 support($0.12), resulting in a further 27% fall. On Feb 24th, the sellers tried to extend these losses, but the bulls defended this level with vigor, resulting in a long-tail rejection candle.
The Relative Strength Index(40) surged from the oversold territory and has breached the 14-SMA line. The rising slope indicates the increasing underline bullishness.
Can EMA Death Crossover revert the ongoing ONE price rally?

Source-Tradingview
The Harmony (ONE) price bounced back from the $0.12 support forming a daily-morning star candle pattern. Today, the buyers follow up on the recovery, displaying the coin has gained 28% from the bottom support. Furthermore, the buyers gave a bullish breakout from a falling expanding channel.
The bullish rally could soon retest overhead shared resistance of $0.17-$0.165 and 20-day EMA. A successful breakout from this level would offer a recovery opportunity for ONE holders.
On a contrary note, if sellers rejected the coin price from $0.165, it would indicate the support has flipped to resistance threatening a further downfall.
ONE price chart shows a bearish alignment among the crucial EMAs(20, 50, 100, and 200). Moreover, the 50-and-200-day EMA shows a death crossover, luring more sellers into the market.
- Resistance- $0.17-$0.165, and $0.198
- Support- $0.143, and $0.12


