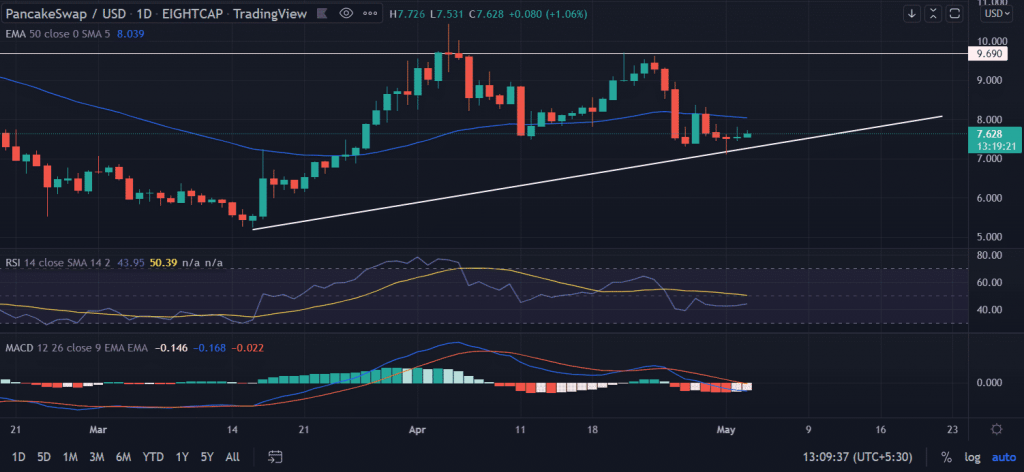
CAKE price continues to trade sideways for the past three-session following a dull start to a fresh trading week. The price hovers near the multi-week support area at around $7.50. In the April series, CAKE price remains in the downswing trailing the broader crypto space fall with a descent of nearly 36%.
- CAKE price continues to trade in a tight range with no clear directional bias.
- A decisive break above $8.0 could bring more gains in the price.
- The ascending trend line from the lows of $5.24 acts as a support for the bulls.
CAKE price slides into a consolidation
On the daily chart, the ascending trend line from the lows of $5.24 acts as a strong support barrier to the bulls. Further, the price attempted to challenge the 50-day EMA (Exponential Moving Average) at $8.03. Further, a renewed buying pressure could push the price to move in the north direction.
By analyzing the trend on the daily chart, we found CAKE is harboring a strong support zone around $7.5. The price surged 67% to the swing highs of $10.42. But the bulls failed to extend the gains and retraced lower, the formation of multiple Doji candlesticks indicates the price could bounce back from here.
If that happens, the first upside challenge could be at a psychological $8.0 followed by the horizontal resistance level at $9.69.
While things look optimistic for CAKE so far, still a spike in the selling orders could reverse the prevailing trend. The price could fall back to recapture the bullish trend line at $7.08. Further, if the slope line is broken we could see the lows of March 26 at $6.86.
Trending Stories
The Relative Strength Index (RSI) is trading near 42. The indicator slips below the average line on April 25.
The moving average convergence divergence (MACD) hovers below the midline with decreasing bearish momentum.
As of press time, CAKE/USD reads at $7.62 with gains of 1.06% for the day.


