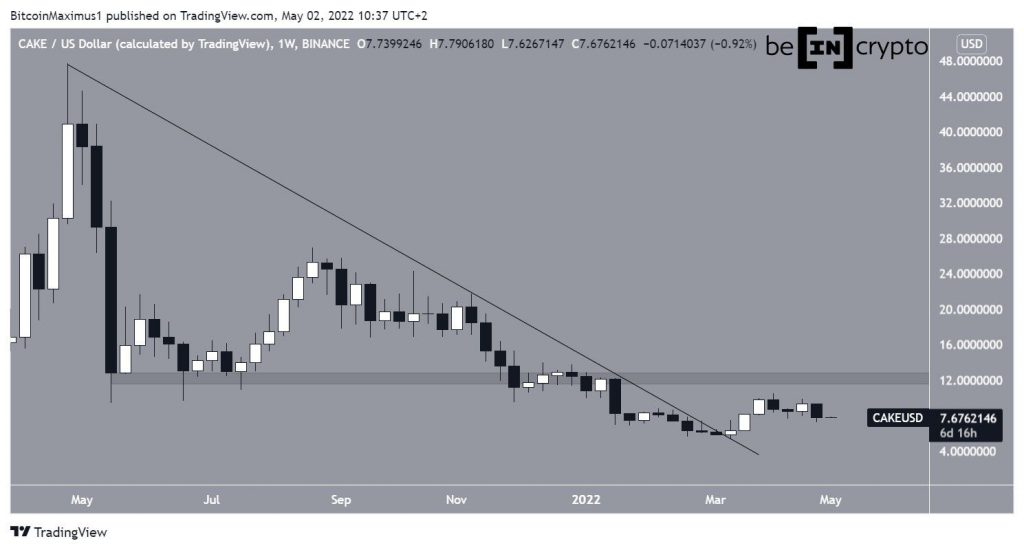
Since breaking out from a long-term descending resistance line, PancakeSwap (CAKE) has shown several bullish signs and is attempting to create a higher low.
CAKE has been decreasing underneath a descending resistance line since reaching an all-time high price of $47.68 on April 30. The downward movement led to a low of $5.31 on March 15.
The price has been moving upwards since and broke out from the resistance line two days later. At the time of the breakout, the line had been in place for 309 days. This can be seen as a sign that the correction is complete.
CAKE is currently attempting to create a higher low, which would be the first step in the creation of a bullish structure.
If it is successful in doing so, the next resistance would be at $12.
Bullish indicator readings
Technical indicator readings for CAKE in the daily time frame are bullish. Firstly, they show that the breakout from the long-term line was preceded by bullish divergences in the RSI and MACD (green lines). Such divergences often precede bullish trend reversals.
Additionally, the divergence trendline of both indicators is still intact, suggesting that the bullish structure is also intact.
Similarly, the six-hour time frame shows a similar bullish divergence that has developed in the RSI (green line).
Additionally, the price action is also bullish. It shows that CAKE has reclaimed the $7.60 horizontal area after previously deviating below it (red circle). This is a bullish development that often leads to upward movements. Furthermore, the bounce served to validate the 0.618 Fib retracement support level.
Short-term CAKE movement
Trader @Jamyies tweeted a chart of CAKE, which shows that the price has broken down from a parallel channel.
However, after the breakdown and ensuing descent, CAKE was able to reclaim the $7.60 resistance area. It is currently in the process of validating it as support.
Additionally, it is likely that the price has already completed an A-B-C corrective structure.
While it is possible that one more downward movement towards $7 will ensue (red circle), the bottom seems to be close.
For Be[in]Crypto’s latest Bitcoin (BTC) analysis, click here
Disclaimer
All the information contained on our website is published in good faith and for general information purposes only. Any action the reader takes upon the information found on our website is strictly at their own risk.


