Bitcoin (BTC) is currently moving sideways near the $41,000 level after rebounding from the strong support level in the last two days.
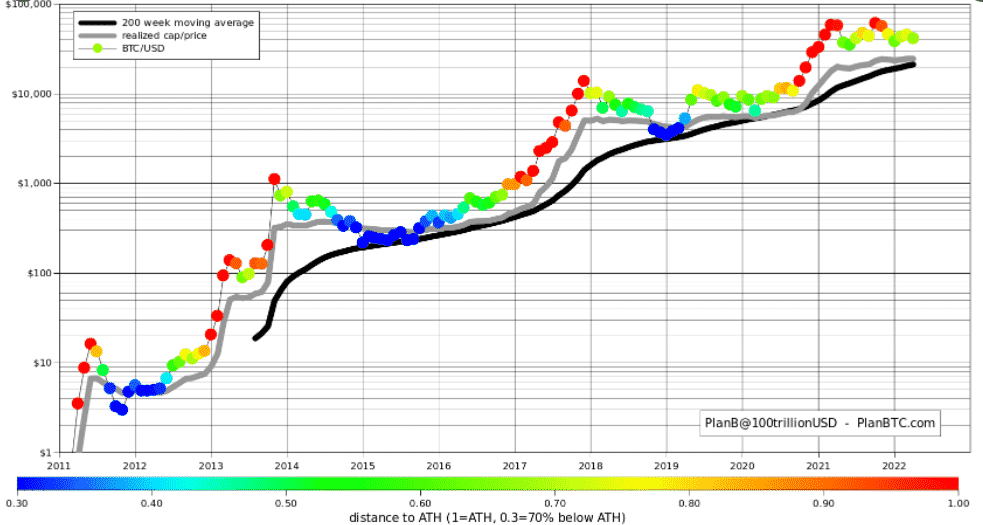
With Bitcoin investors being skeptical over whether to buy at current levels or wait for a further dip, PlanB, the creator of the popular Stock-to-Flow (S2F) model, noted that the token’s realized price is near the 200-week moving average (WMA).
Bitcoin (BTC) Price Approaches 200-Week Moving Average
PlanB has said in a tweet on April 20 that Bitcoin’s (BTC) realized price is near the 200-week moving average. Interestingly, the 200-week moving average heatmap is a key indicator by PlanB that predicts when BTC price has bottomed out. In the last two bitcoin market cycles, the BTC price had bottomed out around the 200-week moving average.
Meanwhile, the Bitcoin realized price near the 200-WMA indicates when a massive rally in Bitcoin can be expected. Historically, in 2016-end and mid-2020, the Bitcoin price rose massively after realized price reached the 200-WMA level. This could be the third time when a massive bullish rally could be seen from the current levels, as the realized price is near the 200-WMA again.
Bitcoin 200-Week Moving Average Heatmap can be easily used to predict BTC price. Orange and red dots indicate a good time to sell Bitcoin as the market overheats. Whereas, purple and blue dots near the 200-week moving average have historically been good times to buy.
Trending Stories
BTC Price Builds Bullish Momentum
Bitcoin price has rallied significantly higher after the recent bloodbath in the crypto market. At the time of writing, the BTC price is up nearly 5% in the last seven days and 2.5% in the last 24 hours. The price is currently trading at $41, 579.
Moreover, the Bitcoin whales have utilized the ‘Buy The Dip’ opportunity to accumulate Bitcoin. The Nasdaq 100 index, which BTC tracks closely, has also risen over the past two days.


