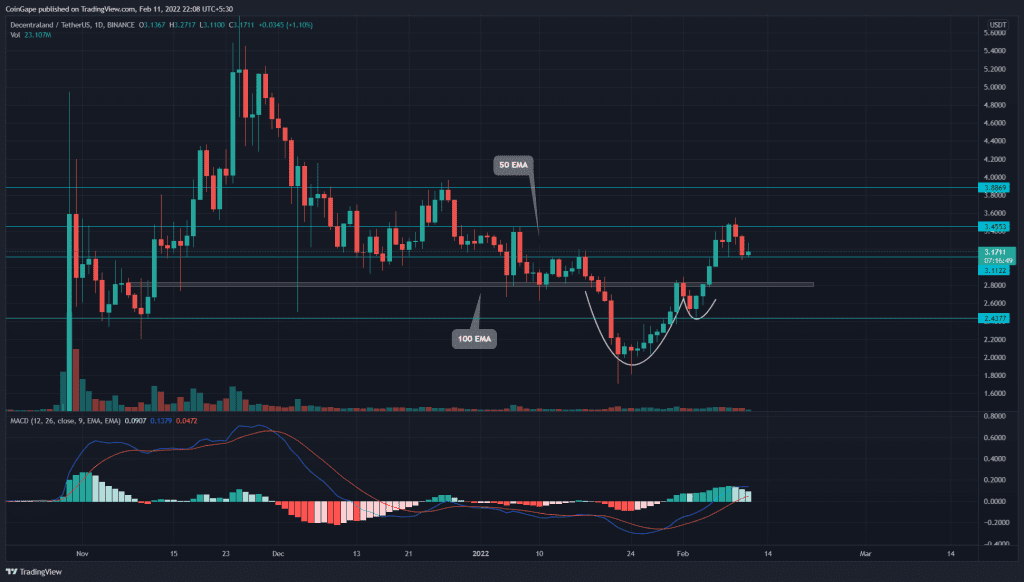
The Decentraland (MANA) technical chart indicates a reversal to retest the bullish breakout of the cup and handle pattern in the daily chart. However, this brings a shorting opportunity in a shorter time frame. Should you consider this as a trading opportunity to sell?
MANA Price Retests The Rounding Bottom Breakout
Source-Tradingview
On February 5th, the Decentraland (MANA) price gave a decisive breakout from the $3.1 neckline of the cup and handle pattern. However, the above retracement acts as a retest of this flipped support, providing a long entry opportunity
The sideways movement of the fast line in the MACD indicator showcases a bearish crossover possibility.
The price action suggests the crucial support levels for MANA price at $3.10, followed by a horizontal level at $2.85 in the 4-hour chart. Meanwhile, the resistance levels are $3.45 and $3.85.
Decentraland (MANA) Technical Analysis
- The daily-MACD Indicator lines enters the positive territory
- The 20 and 50 EMAs provides a bullish crossover in the daily time frame chart
- The intraday trading volume in the MANA coin is $734 Million, indicating a 27.8% loss.

Source- Tradingview
The MANA price shows a retracement of 10.5% in the rising expanding channel. The price action resonates in a falling channel pattern from the resistance trendline.
The altcoin price may find support near the high-demand confluence area near the $3.10. The support trendline, horizontal level of $3.10, and the 100-day EMA coincide to form the shared support.
Speaking of EMAs, the crucial exponential averages of 50, 100 and 200 maintain a bullish alignment in the 4-hour chart.
The RSI indicator shows a Zig-zag movement of the slope near the 50% mark. However, the bearish divergence present near the $3.10 projects a downfall possibility.


