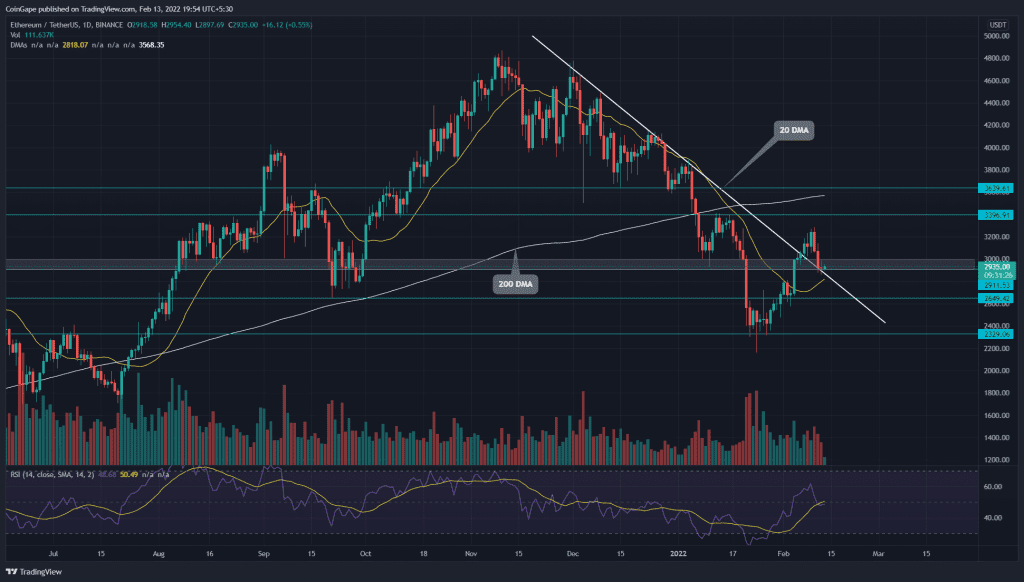
The recent recovery in Ethereum price marked a high of $3280. This rally breached the combined resistance $3000 psychological level and a long coming descending trendline. However, the Ethereum price reverts to test these levels for sufficient demand.
Key technical points
- The 20-day DMA acted as strong support for ETH
- The daily-RSI struggles to sustain in bullish territory
- The intraday trading volume in ETH/USD is $9.5 Billion, indicating a 31.2% fall.
Source- Tradingview
Amid the recent recovery in the crypto market, Ethereum price pierced the highly influential descending trendline on February 9th. The breakout carried the altcoin to the $3287 mark, indicating a 51% gain from the previous swing low of $2330.
The ETH price spent its last three days to retest the descending trendline. The coin is currently hovering above the shared support of the $3000-$2900 zone and breached the trendline, looking for sufficient demand.
The ETH price trading below the 100 and 200 DMA maintains a bearish trend. However, the recently flipped 20 DMA curving up provides an extra edge to long traders.
The daily-Relative Strength index(49) slope wavering around the midline, indicating a neutral sentiment.
Rising Trendline Brings Additional Support To ETH Price

Source-Tradingview
The rising trendline accentuates the importance of the $2900 support zone. If Ethereum price rebounds from this support, the buyers will rechallenge the overhead resistance of $3400, followed by the immediate resistance of $3600.
Contrary to the bullish assumption, if sellers sink the altcoin below the base support, it would indicate the bears are selling on rallies, and the ETH price would plunge to $2650 or $2330
The moving average convergence/divergence indicator shows the MACD and signal have recently slid below the neutral zone. However, the bears couldn’t keep up the selling pressure, resulting in faded red bars in the histogram chart.
- Resistance levels- $3400, $3650
- Support levels are- $3000-$2900 and $2650


