Polkadot (DOT) has been moving upwards since Feb 24 and has created two higher lows so far. It is following a short-term ascending support line.
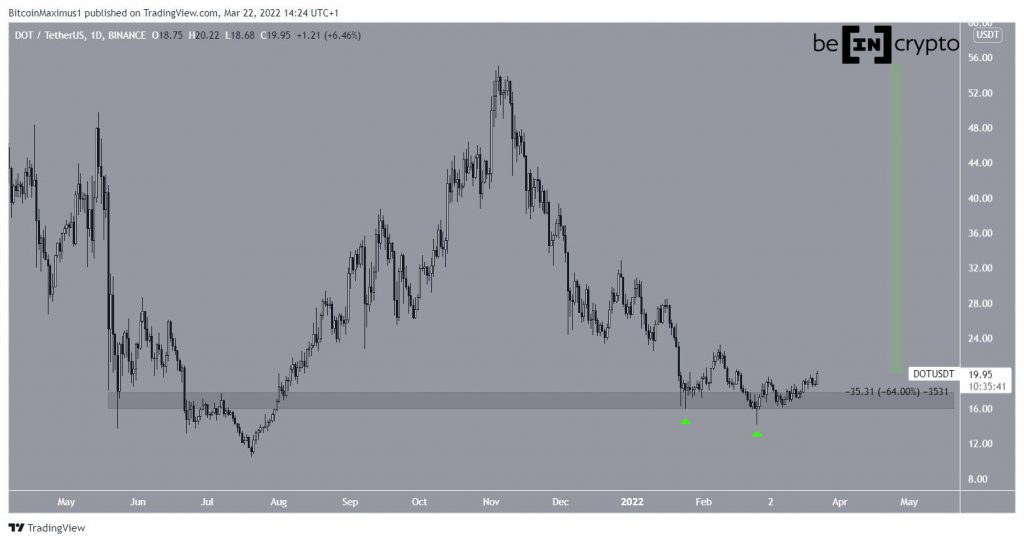
DOT has been decreasing since reaching an all-time high price of $55.09 on Nov 4. The downward movement caused the price to return to the $17 horizontal support area in Jan and Feb.
Once there, it bounced and created two long lower wicks (green icons), which are considered signs of buying pressure. Furthermore, it is possible that it has created a double bottom, which is considered a bullish pattern.
Despite the ongoing increase, measuring from the all-time high, DOT has decreased by 64% so far.
Will the upward movement continue?
Cryptocurrency trader @CryptoNTez tweeted a chart of DOT which shows that the price has begun a small upward movement.
Technical indicators for DOT in the daily time-frame support the continuation of the upward movement.
Both the RSI and MACD are moving upwards after generating bullish divergences. Furthermore, the RSI has already moved above 50 while the MACD is nearly positive. Both of these readings are associated with a bullish trend.
If the upward movement continues, the next closest resistance area is at $29.75, created by the 0.382 fib retracement resistance level.

The six-hour chart supports this assessment. It shows that DOT has broken out from a descending resistance line (dashed) and is following a shorter-term ascending support line.
As long as the line is in place, the bullish trend remains intact.

DOT/BTC
The DOT/BTC chart paints a similarly bullish picture. On March 17, the price broke out from a descending wedge that had been in place since Nov 2021.
The descending wedge is considered a bullish pattern, so a breakout was the most likely scenario.
If the upward movement continues, the first resistance area is at 52,000 satoshis while the next one at 65,000 satoshis.

For BeInCrypto’s latest Bitcoin (BTC) analysis, click here
Disclaimer
All the information contained on our website is published in good faith and for general information purposes only. Any action the reader takes upon the information found on our website is strictly at their own risk.


