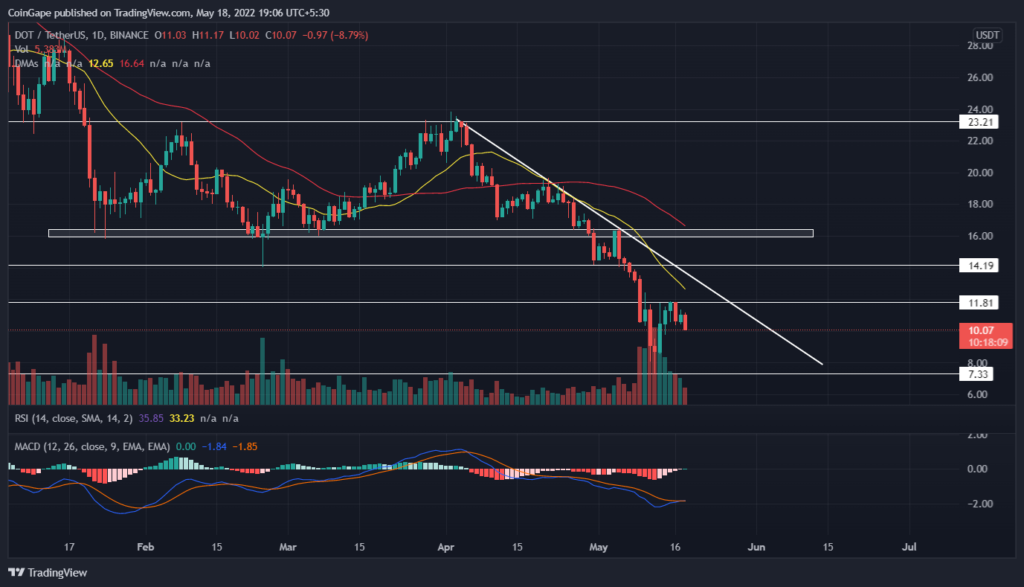
The ongoing correction plunged the Polkadot(DOT) price to the $7.35 mark, tagging along the descending trendline. Furthermore, a reversion from this support with a morning star candle prompts an occasional pullback for the DOT price. however, recovery rally couldn’t sustain above the $10.5 mark triggers a resistance fakeout.
Key points:
- The DOT price is approaching the overhead trendline.
- The 20 DMA aligned with the dynamics resistance trendline.
- The 24-hour trading volume in the Polkadot coin is $855 Million, indicating a 13% gain.
Source-Tradingview
The Polkadot(DOT) price action witnessed a range-bound throughout the last four months, hovering between $23.45 and $15.90. However, following the breakdown of the range support, the price sank 68% to $7.35.
Furthermore, the coin has used the $7.35 levels as support over the last week and is now steadily making its way towards the dynamic overhead trendline. This steady move has recovered close to 43% of the DOT’s price from $7.35 to $10.55.
However, despite the attention of the buyers and the minor loss recovered in the last few days, the DOT buyers failed to sustain above the $10 mark. Today, the altcoin is down by 10% on the intraday level and pierced the $10 mark, reflecting a support fakeout.
Trending Stories
If the coin submits to the downward pressure, the DOT price will sink back to $7.35. The likely reversal would threaten to cause a bearish breakdown.
advertisement
An unexpected rise in bullish momentum may undermine the dynamics’ resistance and trigger a new recovery rally.
Technical Analysis
The MACD indicator’s failed attempt for a bullish crossover between the MACD and signal line bolsters the bearish thesis to revisit the $7.5mark.
The 20 DMA carrying the ongoing correction puts constant selling pressure on the DOT. Moreover, a bearish alignment among the crucial DMAs suggests multiple resistance above.
- Resistance levels- $10.3 and $17.5
- Support levels- $7.3 and $6


