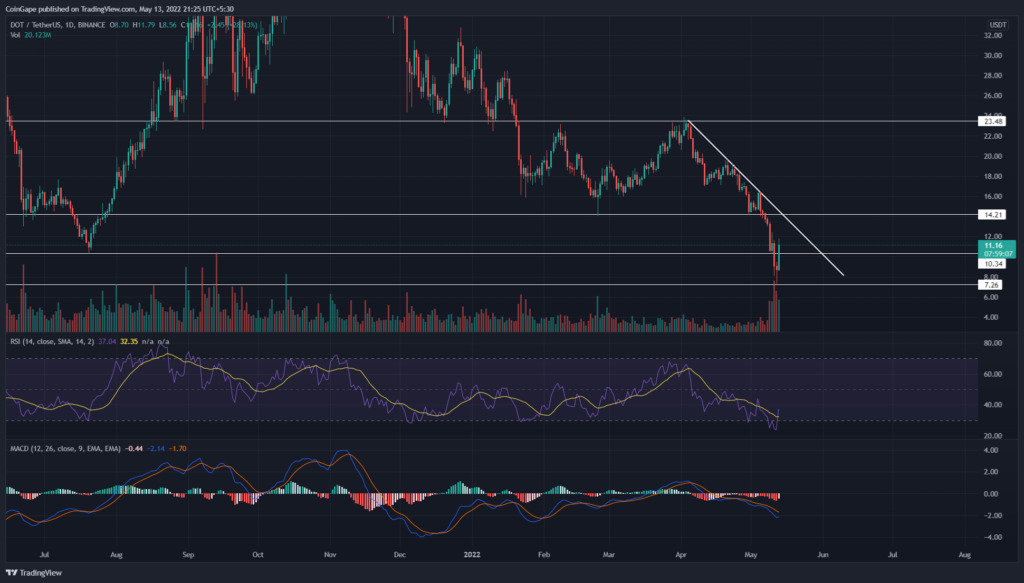
A descending trendline carrying the ongoing correction plunged the Polkadot(DOT) price to $7.3. However, the coin price reverted from this support with a morning star candle, prompting an occasional pullback.
Key points:
- The DOT price approaching the overhead trendline
- The 20 DMA aligned with the dynamics resistance trendline
- The 24-hour trading volume in the Polkadot coin is $1.8 Billion, indicating a 10% loss.
Source-Tradingview
During the last four months, the Polkadot(DOT) price witnessed a range-bound rally, resonating between the $23.5 and $16 mark. However, a recent reversal from the range resistance responded to the descending trendline and tumbled x% down to $16.
However, last week’s sell-off in the crypto market accelerated the selling pressure and slumped the DOT price below $16. As a result, the downfall tumbled the altcoin by another 48% and plunged it to $7.3 support.
Furthermore, a low volume reversal from this support indicates a minor relief rally which would soon continue the prevailing downtrend. The DOT price currently trades at $11.05, with an intraday gain of 26.8%.
Trending Stories
If buyers continue to push higher, the altcoin will retest the overhead resistance trendline to replenish the selling momentum. The possible reversal would revisit the $7.3 support and threaten a bearish breakdown.
Conversely, a sudden rise in bullish momentum could breach the resistance trendline to kickstart a new recovery rally.
Technical Analysis
The MACD slope shows a sudden rise and reduces its gap with the signal line. These lines nearing a bullish crossover could bolster buyers to breach the overhead trendline.
However, a recent negative crossover between the 50-and-100-day DMA completes a bearish alignment between the 20, 50, 100, and 200 DMAs. Moreover, the coin price trading below these DMAs, indicates the path to least resistance is downward.
- Resistance levels- $14.2, and $17
- Support levels- $10.2 and $7.3


