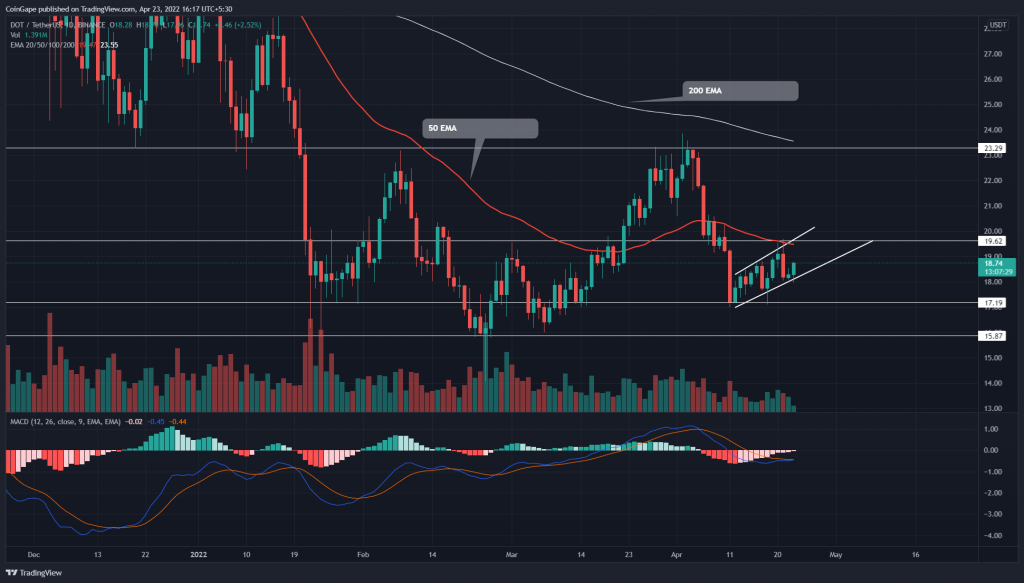
Responding to the crypto market correction, the Polkadot (DOT) price action forms an inverted flag pattern and preps a breakout of the support trendline. Hence, the bearish continuation pattern may shortly showcase a support trendline fallout to retest the $17 mark.
Key points:
- The $20 is a troublesome barrier for DOT buyers.
- Range breakout will trigger a directional move in DOT price.
- The 24-hour trading volume in the Polkadot coin Inu coin is $662.3 Million, indicating a 63.5% gain.
Source-Tradingview
A bearish reversal from the February 8th peak($23) triggers a sideways rally for Polkadot (DOT). Unfortunately, this V-shaped reversal tumbled the altcoin by 28.6%, bringing it to $17.18 support.
Trending Stories
The coin chart displays a relief rally that surged the price by 15.4% higher than the $19.66 mark. However, this minor recovery reflects an inverted flag pattern.
advertisement
The pattern usually accelerates the prevailing trend, after a minor recovery such as this one. If the coin price breached the bottom support, the correction rally would extend and reach the Feb low support at $14.20.
On a contrary note, if buyers defend the support trendline, and rise above the 50-day EMA, the DOT price could rise to $23.
Technical Analysis
The downsloping 50-and 200-day EMAs project a solid bear cycle, with the 50-day providing the recent hurdle rejecting the uptrend. However, a potential breakout of the 50-day EMA will reach the 200-day EMA accounting for a growth of 20%.
The MACD and signal lines are ready to merge below the zero line and will potentially ignite a bullish crossover. Hence, the indicator is projecting a weak buying signal and will shortly make it official with a crossover.
Resistance levels- $22.5, and $27.3
Support levels- $16.78 and $10


