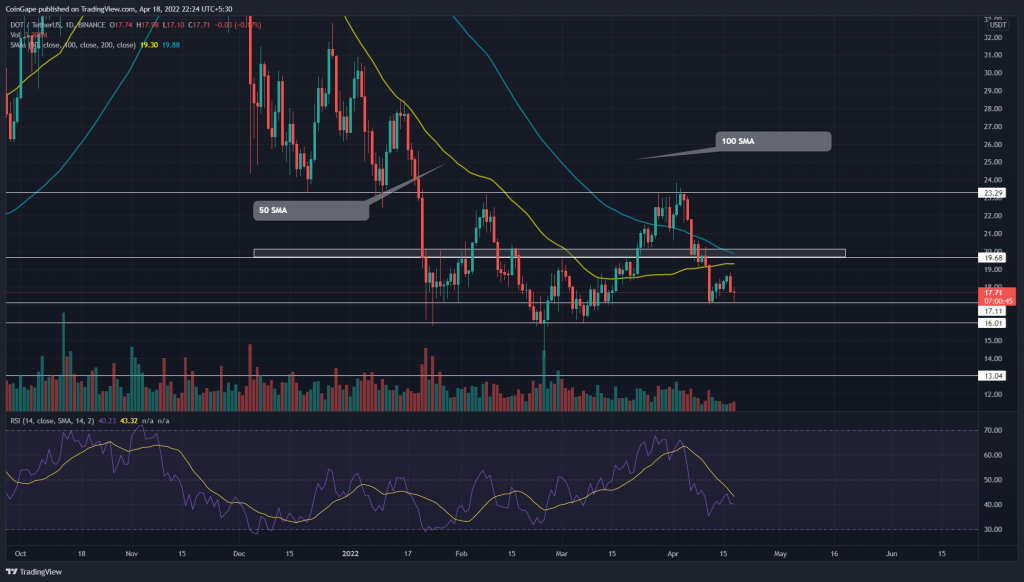
The recent bear cycle sunk the Polkadot(DOT) price to $17 support, registering a 26.3% loss. The altcoin retesting this range bottom support under the influence of RSI divergence suggests that history may repeat itself and revert the price to higher levels. However, a breakout from either level of the range will determine the upcoming trend.
Key points:
- The $20 is a troublesome barrier for DOT buyers
- Range breakout will trigger a directional move in DOT price
- The 24-hour trading volume in the Polkadot coin is $662.3 Million, indicating a 63.5% gain.
Source-Tradingview
Since the January bloodbath, the Polkadot(DOT) price has been wobbling between the $23.5 and $16 levels, marking a range-bound rally. Furthermore, the recent reversal from the overhead resistance triggered a sharp sell-off of 26.5% and plunged the coin price to the $17 support zone.
As DOT price retest the $17 mark with a 60% pump in trading volume, it is likely the sellers may dumb the coin to $16 bottom support.
Responding to the bullish RSI divergence, the DOT/USDT pair may rebound from the bottom support and continue the sideways rally. However, the bull cycle needs to break a shared resistance of $20 psychological level and 100-day SMA before reaching the $23.5 mark.
Trending Stories
On a contrary note, a daily candlestick closing below the $16 mark will invalidate the bullish thesis and sink the altcoin 18.5% down to $13.
Technical Analysis
The downsloping 100-and 200-day SMA reflects an overall bear trend, while the 50-day highlights the current range rally. Moreover, the 50 and 100 SMA moving near the $20 resistance mounts a strong defense ahead.
The daily RSI slopes presented a bullish divergence regarding the two retests on April 11th and 18th. This divergence projects rising bullish momentum near the $17-$16 support zone, suggesting a reversal opportunity.
- Resistance levels- $20, and $23.5
- Support levels- $17-$16 and $13


