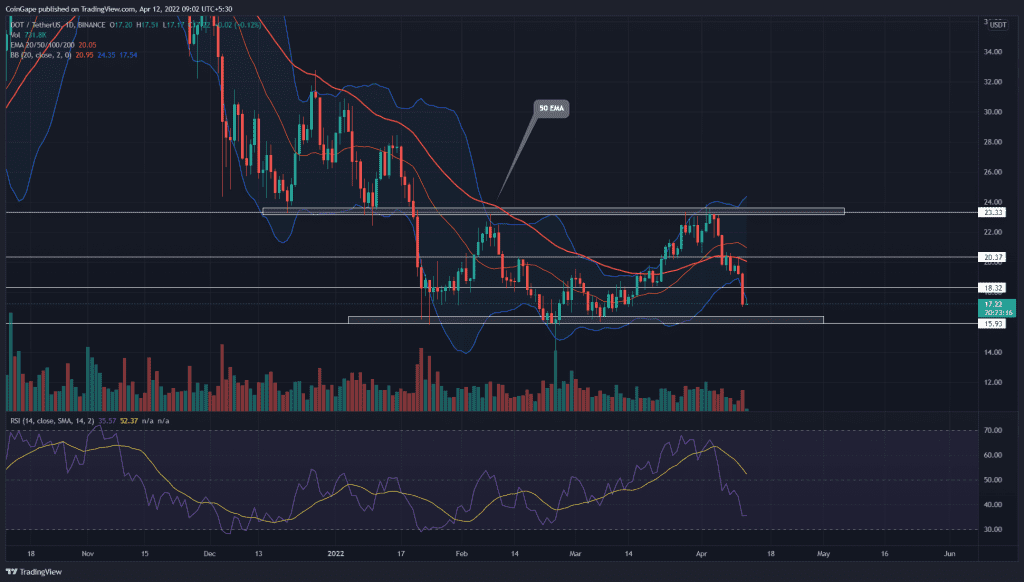
A V-top reversal from the $23 resistance slumped the Polkadot(DOT) price by 26%. The rising supply pressure pierced the $20 psychological support level and continued the charge to last quarter’s support at $16. Should buyers reaccumulate at this bottom support?
Key points:
- The DOT chart shows a negative crossover among the 20-and-50-day EMA
- The daily RSI line approaching the oversold region
- The ongoing correction poked the lower band support of the Bollinger band indicator
- The 24-hour trading volume in the Polkadot coin is $974.7 Billion, indicating a 44.9% gain.
Source-Tradingview
Over the last quarter, the Polkadot(DOT) witnessed several retests to the $16 bottom support. With a bullish RSI divergence displayed at each swing low, the altcoin experienced a significant inflow during the latter part of March.
An ascending support trendline carried the recent bull cycle and surged the coin price by 45%. However, the buyers could not surpass the $23 monthly resistance, resulting in a V-top rejection from the sellers.
A bearish breakdown from the support trendline accelerated the selling momentum and dumped the DOT price below $18.3 support. If the selling pressure sustains, the crypto trades will meet the next significant demand zone at the $16 mark.
Furthermore, if the DOT price rebounds from the $16 bottom support, the traders can expect a range-bound rally for a few more sessions.
Technical Analysis
A bearish crossover of the 20-and-50-day EMA may regain the bearish alignment among the daily EMA lines(20, 50, 100, and 200). These downsloping EMAs indicate that bears possess the trend control.
The Bollinger band indicator moving sideways accentuates a range-bound rally in DOT price. On April 11th, the long bearish candle breached the lower band support, indicating aggressive selling in the market.


