BeInCrypto takes a look at the price movement for seven different altcoins, including Polygon (MATIC), which is very close to reaching a new all-time high price.
BTC
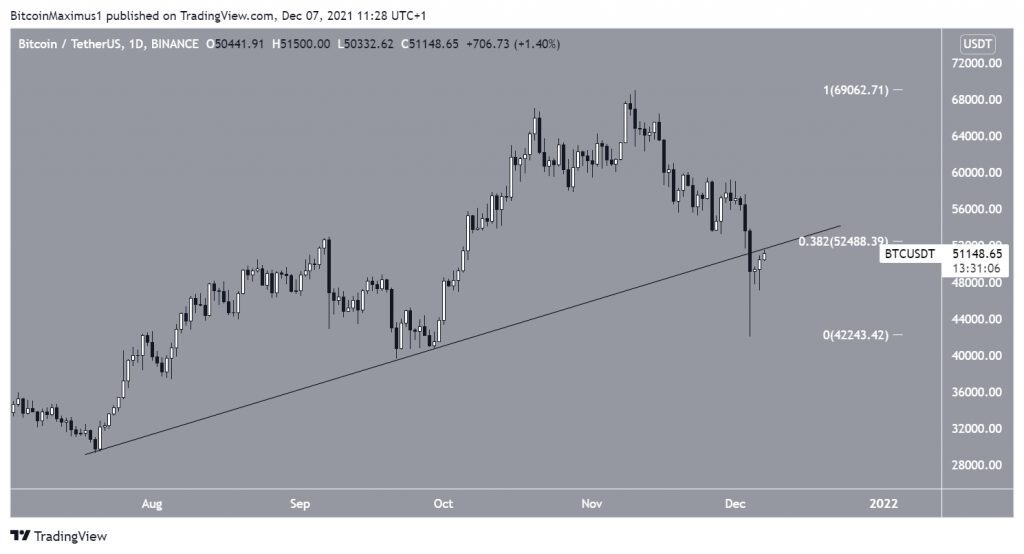
On Dec 4, Bitcoin (BTC) decreased sharply and fell all the way to a local low of $42,000. Following this, it rebounded back above $50,000, creating a long lower wick.
Currently, it’s in the process of retesting the support line but could potentially validate it as resistance. The line coincides with the $52,500 resistance area, which is the 0.382 Fib retracement resistance level.
ETH
Ethereum (ETH) has been falling since Nov 10 after reaching an all-time high price of $4,867. Similar to BTC, the decrease accelerated on Dec 4, and ETH fell to a local low of $3,575.
However, it bounced back shortly after and is currently trading at $4,400.
ETH is still trading above the previous resistance area of $3,950. As long as it’s doing so, the trend can be considered bullish.
A breakout from the descending resistance line would confirm that the correction is complete.
XRP
XRP (XRP) has been falling since Nov 10 when it reached a high of $1.35. The downward move continued until Dec 4, when it dropped to a low of $0.60.
When discounting the wick, the decrease that began on Nov 10 has an exact 1:1 ratio as the dip from Sept 6 to Sept 22.
XRP found its footing above the 0.786 Fib retracement support level at $0.70. Therefore, it’s possible that the correction has come to an end.
LRC
Loopring (LRC) has been decreasing inside a descending parallel channel since Nov 10, after reaching an all-time high price of $3.85.
The decrease led to a low of $1.60 on Dec 4.
The same day, LRC bounced and validated the support line of the channel. Three days later, it reclaimed the midline of the channel. This is a very bullish sign that suggests an eventual breakout could occur.
MATIC
Polygon (MATIC) was subject to a massive decrease on Dec 4, dropping it to a low of $1.54.
However, it regained all of its losses and moved above its previous high on Dec 7.
It’s currently attempting to break out above the $2.40 resistance area, which is the final resistance prior to a new all-time high price.
If successful in moving above it, the next resistance would be found at $3.26.
ROSE
Oasis Network (ROSE) has been following an ascending support line since July 20. On Dec 6, it bounced at this support line, creating a long lower wick in the process (green icon).
It has been moving upwards since.
The main resistance area is found at $0.375, which was last reached on Dec 3 (red icon).
KDA
Kadena (KDA) has been falling since Nov 11, after tapping a new all-time high price of $28.30. The downward move that followed led to a low of $8.90 on Dec 6. This amounted to a drop of 68%.
KDA has bounced back slightly since then, validating the 0.618 Fib retracement level as support. However, it has failed to begin an upward move.
If the support area fails to hold the price, the next support would likely be found all the way back at $6.50.
For BeInCrypto’s latest Bitcoin (BTC) analysis, click here.
Disclaimer
All the information contained on our website is published in good faith and for general information purposes only. Any action the reader takes upon the information found on our website is strictly at their own risk.


