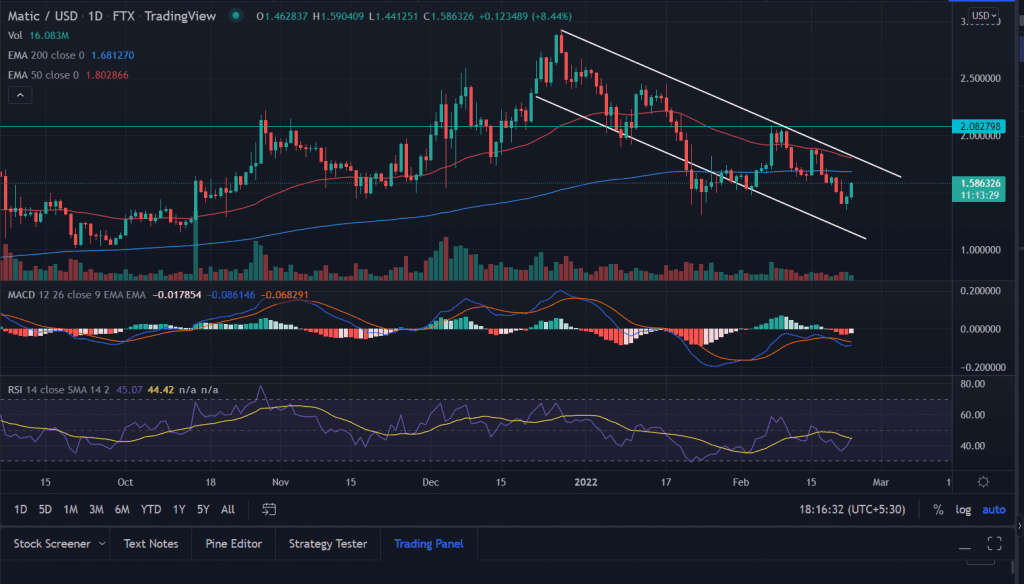
Polygon (MATIC) price rose for the second consecutive session on Wednesday. Investors find some attractive buying opportunities near double bottom formation around $1.40. More upside if the price is able to tag above the 200-day EMA (Exponential Moving Average) at $1.68.
- Polygon (MATIC) some remarkable gains on Wednesday.
- Triple bottom near $1.35 bounces the price toward 50-EMA.
- But Downside remains intact below $2.0.
The 15th largest cryptocurrency by market cap was last seen trading at $1.56 up 6.98% for the day.
MATIC needs to cross upside filters
On the daily chart, Polygon (MATIC) has been trading in a downside channel with classic lower high lower low formation. After devaluating almost 55% from the record highs the price ultimately found some reliable support near the ‘Tripple bottom’ formation around $1.35.
Every time price tested the price level MATIC has seen significant gains since November. Inside the downward price channel, Polygon (MATIC) has sliced below the 50-day Exponential Moving Average (EMA) at $2.20.
Investors make an attempt to retest the 50-day moving average at $1.87 the price retraced 28% to the recent lows of $1.34. This also coincides with the formation of a ‘hammer’ candlestick, which is a bullish formation.
If the price is able to crosses the 50-day EMA, the next upside target is placed at the bearish slop line at $1.83.
A daily or weekly close above this level is essential to meet the psychological $2.0 level.
On the other hand, with a resurgence in the selling pressure, the price could move back to the lows made on Tuesday at $1.34.
Investors would next to keep an eye for $1.26, levels last seen in October.
Technical indicators:
RSI: The Daily Relative Strength Index (RSI) just move toward the moving average line with a bullish bias.
MACD: The Moving Average Convergence Divergence (MACD) still holds below the midline.


