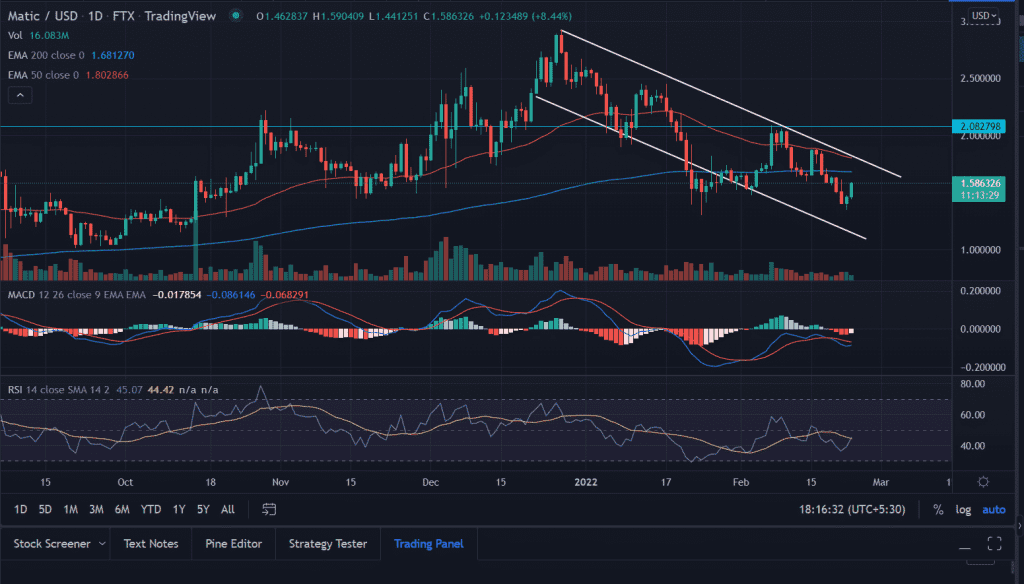
Polygon (MATIC) price fails to capitalize on the previous session’s gains. MATIC opened higher but could not sustain the higher levels. The current price action could extend by another 10% to $1.35 before polygon set any directional basis.
- Polygon (MATIC) trades lower with significant losses.
- A decisive break below $1.26 could trigger a fresh round of selling targeting $1.0.
- However, an acceptance above 200-day EMA invalidates the bullish thesis.
MATIC price has been on a persistent downtrend since December 27, 2021, and has shown no signs of a reversal so far.
At the time of writing, MATIC/USD is trading at $1.51, down 2.01% for the day. As per the CoinMarketCap 24-hour trading volume of the 16th largest cryptocurrency by market cap held at $1,030,261,543 with more than 40% losses.
MATIC continues to trade lower
On the daily chart, Polygon (MATIC) has been trading in a downtrend channel, extending from the record highs of $2.92. Investors meet the reliable support of near $1.25, which has been tested multiple times.
Further, the formation of a ‘long-legged’ candlestick on Thursday suggested sellers have lost their patience and remain sidelined. A spike in buy order produces a green candle following the next day but to continue the upside run MATIC must break above the upside filters placed at 200-day and 50-day EMA placed at $1.67 and $1.09 respectively.
An acceptance above the mentioned levels could further seek the psychological $2.09.
On the flip side, a close below Thursday’s lows would invalidate the bullish theory with the immediate downside target at $1.09, which also coincides with the lower trend line of the downward channel.
Technical Indicators:
RSI: The Daily Relative Strength Index (RSI) is struggling at 42 near the average line.
MACD: The Moving Average Convergence Divergence (MACD) is oscillating below the midline with a neutral bias.


