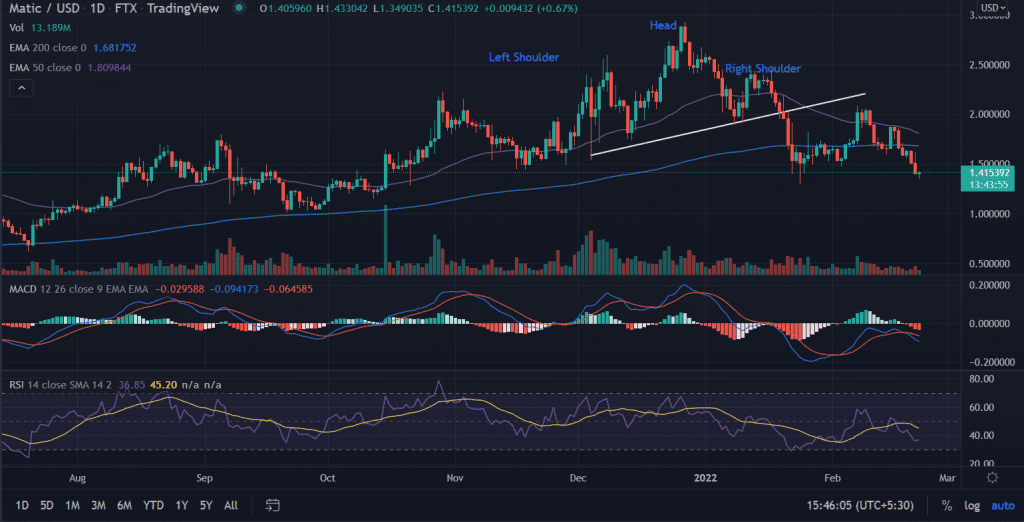
Polygon (MATIC) price action trades in a tight range on Tuesday. MATIC has been on the continuous downward momentum since February 16 with a 35% descent. The formation of a triple bottom near $1.40 suggests a reversal from the current levels.
- Polygon (MATIC) price trades with modest gains bucking the previous day’s trend.
- A close above $1.50 could reverse the downward trend.
- Investors seek an upside of 45% from the current levels.
As of press time, MATIC/USD is trading at $1.40, down 0.31% for the day. The 16th largest cryptocurrency by the market cap held the 24-hour trading volume of $1,758,620,513 with more than 100% gains.
MATIC trades near critical level
Polygon (MATIC) has formed a ‘Head $ Shoulder’ pattern a bearish reversal pattern. After the price of MATIC peaked at $2.92 marking an all-time high it retraced back almost 55% towards the lows made in January.
The selling pressure intensified as soon as MATIC breaks the neckline of the described trading pattern. As the price sliced below the 200 EMA and 50 EMA crucial level sellers continue to liquidate their positions. Finally, the downside finds some reliable support level at $1.40.
A spike in buying order could push the price toward the 200-dayEMA (Exponential Moving Average) at $1.70. Furthermore, a decisive close above the 50-day EMA has the potential to take out the psychological $2.0.
On the flip side, if the price breaks the multiple support then the immediate downside target could be found at $1.03. The levels were last visible in September.
Technical Indicators:
RSI: The Daily Relative Strength Index (RSI) pierced below the average line while reading at 35. Any uptick in the indicator could support the upside run in the pair.
MACD: The Moving Average Convergence Divergence (MACD) holds below the midline with a bearish bias.


