Published 6 seconds ago
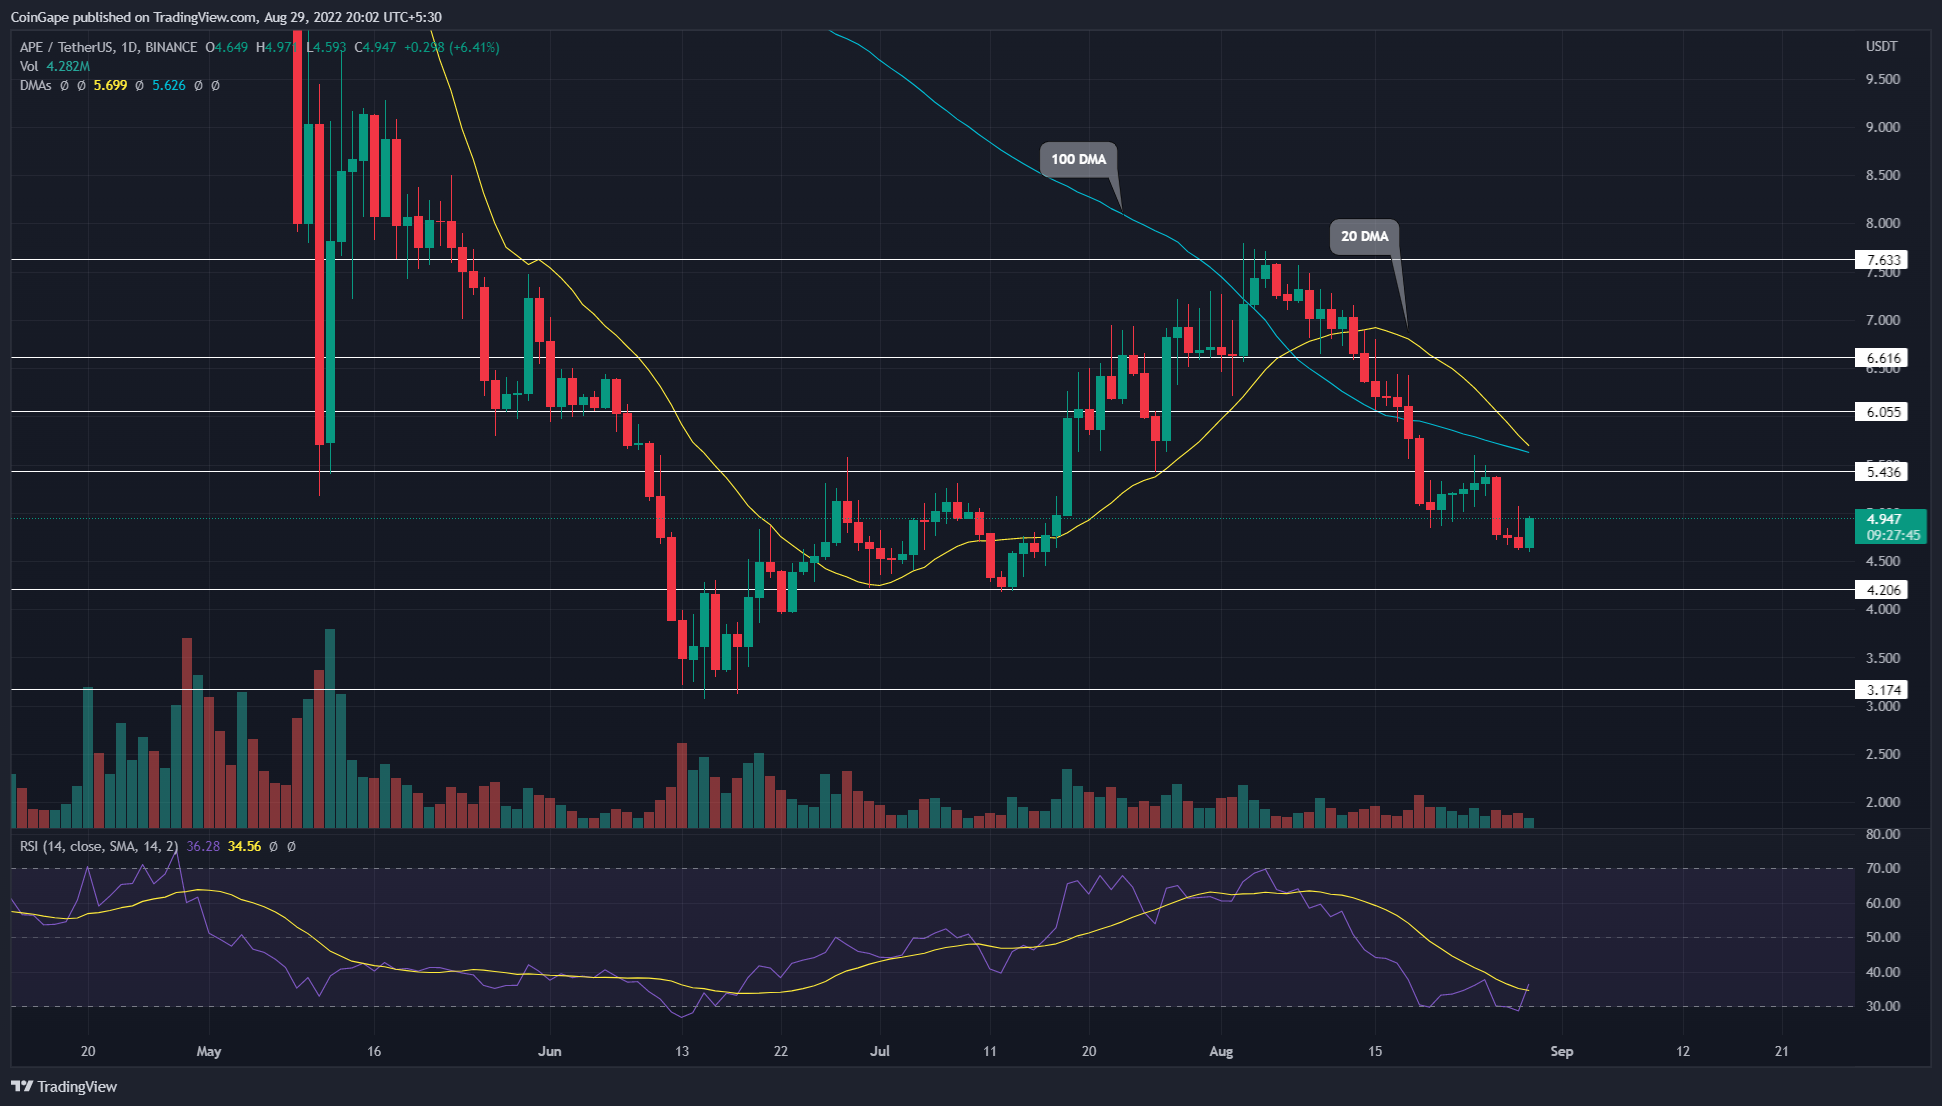
The Apecoin(APE) price retested the breached support level of $5, giving an entry opportunity for coin sellers. However, a bullish engulfing candle during the retest phase with a significant jump in volume indicate the buyers are quite aggressive at the lower levels.
advertisement
Key points of APE Analysis:
- The APE price shows sustainability below $5
- The coin price nosedive below 0.618 Fibonacci retracement level
- The intraday trading volume in Apecoin is $616.5 Million, indicating a 13% loss.

Source- APE/USD chart by Tradingview
A V-top reversal from the $7.7 resistance plunged the APE prices to the $4.9 mark, indicating the correction phase has evaporated nearly 61.8% gains obtained during the—Mid-June to August recovery.
Trending Stories
The downfall registered a 36% loss concerning the local top of $7.7. Furthermore, the sellers have knocked out several support levels during the ongoing correction, which is the most recent is $5.
However, the APE took a midway reversal with a bullish engulfing candle which retested the breached support of $5. Today, the coin price is 0.5% down and shows sustainability at this lower level.
With sustained selling, the APE price should plummet 14% to reach the $4.25 support. But, the price action confirmation will be the ultimate entry signal for sideline traders.
On a contrary note, if buyers could push the prices above $5.5 resistance, the coin holders may get a recovery opportunity and challenge the prior swing high of $7.78.
Technical Indicator
EMA’s: the down-sloping 20-and-100-day EMA reflects both the long-term and short-term, reflecting a bearish outlook. Moreover, these EMAs.nearing a bearish crossover, could offer an added confirmation for sellers.
advertisement
RSI indicator: the daily-RSI slope rebounded from the oversold neckline, indicating the buyers are reacting at discounted APE prices. Moreover, a bullish divergence in this momentum indicator suggests the rising underlying bullish momentum.
- Resistance levels: $5 and $5.5
- Support levels: $4.62 and $4.22
Share this article on:
The presented content may include the personal opinion of the author and is subject to market condition. Do your market research before investing in cryptocurrencies. The author or the publication does not hold any responsibility for your personal financial loss.


