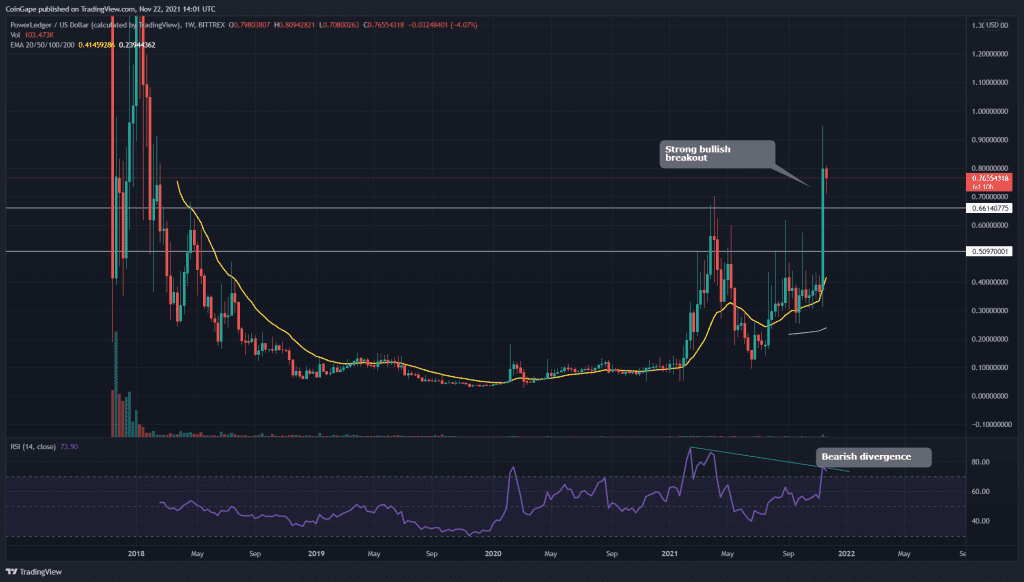
Last week the POWR token showed a significant surge in its price, indicating a total gain of 120%. With this rally, the token price breached the neckline of the Cup and Handle pattern, revealing a great opportunity for crypto traders.
Key technical points:
- The POWR token price has a weekly candle closing above the $0.66 resistance level
- The daily RSI chart displays a bearish divergence concerning POWR price
- The intraday trading volume in the POWR token is $238.7 Million, indicating a 76% loss
Source- POWR/USD chart by Tradingview
The POWR token technical chart indicated an excellent long opportunity for the crypto traders with a Cup and handle pattern in the daily time frame chart. The last week’s rally significantly helped the pattern complete its handle potion and provide a decisive breakout from the $0.66 neckline.
According to the weekly chart-EMAs(20, 50, 100, and 200), the token is under a strong uptrend as its price is trading high above these EMA lines.
The Relative Strength Index value at 74 indicates a strong bullish sentiment for this token. However, the bearish divergence spotted in the RSI chart indicates some weakness in this rally.
POWR/USD Chart In The Daily Time Frame

Source- POWR/USD chart by Tradingview
The POWR token is currently retracing back to retest the neckline of the bullish pattern. However, with the bearish divergence in the RSI and several higher price rejection candles in this chart, the crypto traders should ensure the price receives sufficient support in the retest phase before taking a new long position.
The Fibonacci retracement levels indicate the important levels for this token are $0.671, followed by 0.6 and 0.51.
.


