Helium, Harmony, and BAT have maintained an uptrend over the past few days. These coins have been on the list of top gainers today as each of the coins has brought home double-digit gains in the last 24 hours.
Helium appreciated by almost 20% in the last 24 hours, while Harmony zoomed up by 17% and BAT logged in a 10.1% gain. All the coins mentioned above have held above their long-standing support levels. Here’s an insight into how the coins could perform over the subsequent trading sessions.
Harmony/HNT/USD Four Hour Chart
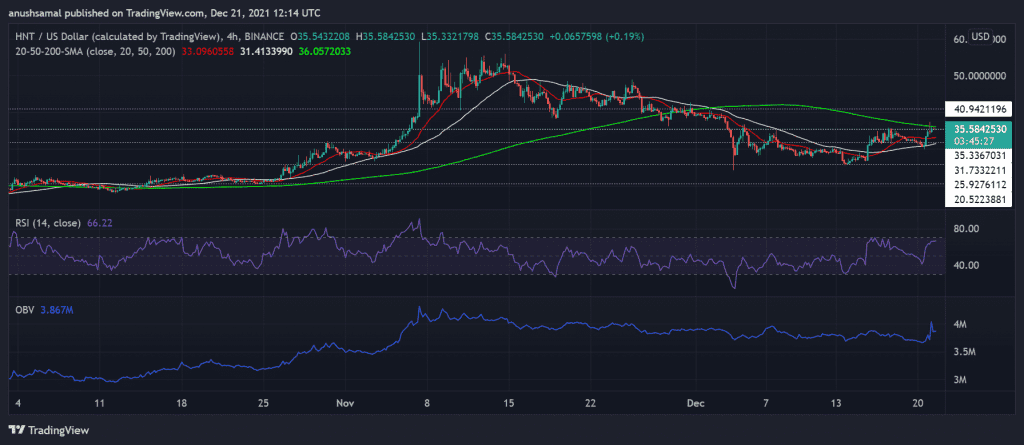
Helium’s price action was quite positive in the last few days. At press time, the coin was trading at $35.58. Although Helium registered a whopping 20% gain, the coin had encountered resistance at the $35 level a couple of times in the past few days.
On the flip side, the coin’s support level stood at $35.33 and then at $31.73. The coin price was seen above the 20-SMA, which meant buyers in the market dictated price momentum.
The Relative Strength Index was seen hovering near the overbought zone after re-testing the level in the last six days. The buying strength recovered as the coin was on the rise owing to new developmental news regarding the implementation of DISH Network. On Balance Volume also indicated that selling pressure had plunged.
ONE/USD Four-Hour Chart
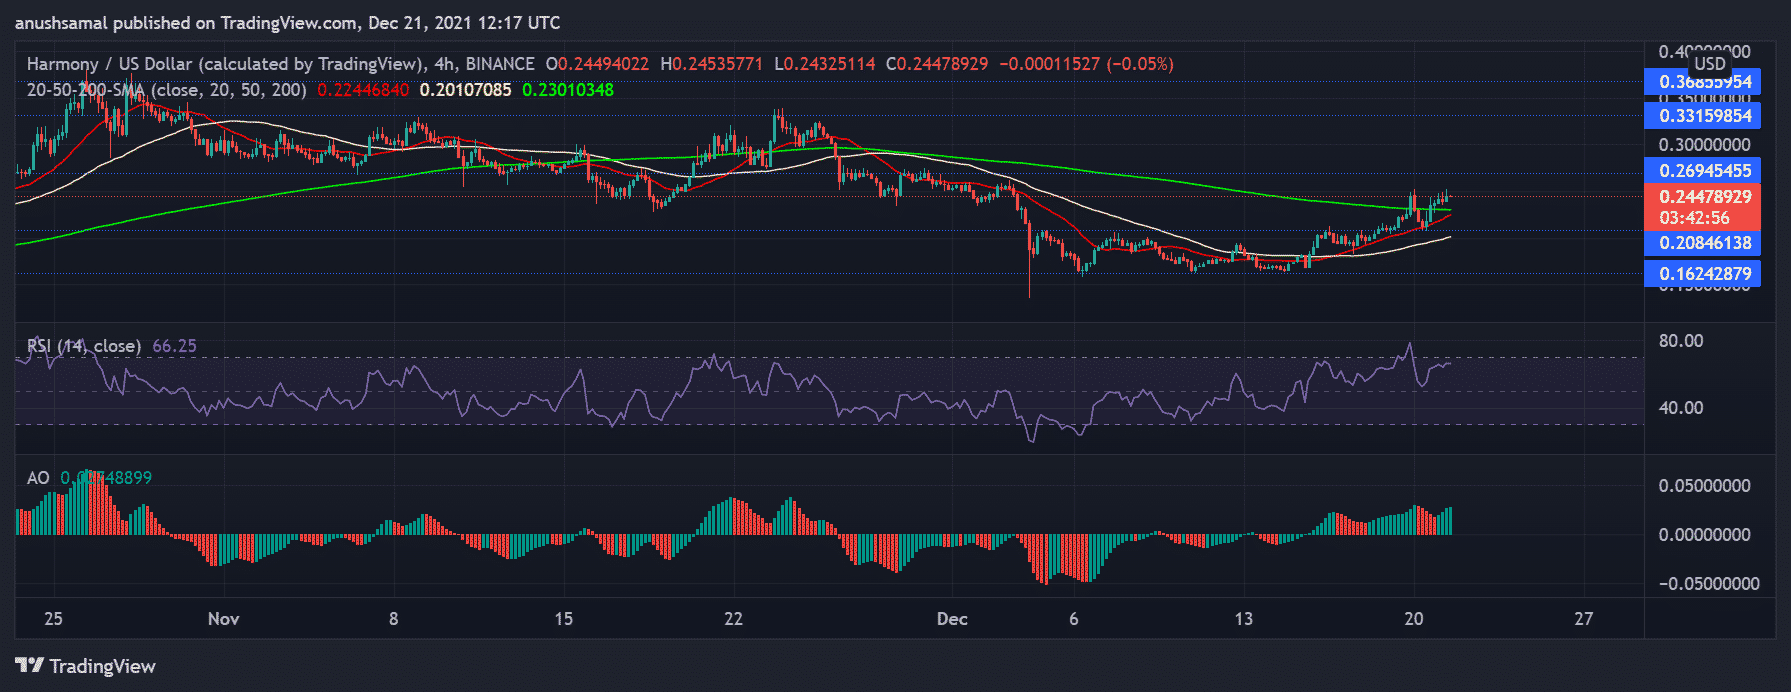
Harmony’s price action saw an uptrend love the last one week as the coin maintained moving in an ascending manner. Over the previous 24 hours, the altcoin soared over 17% and was trading at $0.244.
The overhead price ceiling for ONE to cross stood at $0.269, while the support line rested at $0.208. Harmony’s prices were seen above the 20-SMA, which indicated that buyers and investors in the market drove prices.
Following the above line, the Relative Strength Index was near the overbought and overvalued zone. A fall in buying strength could cause prices to fall. The Awesome Oscillator displayed amplified green histograms owing to the bullish price action taking over. As mentioned above, the resistance mark for ONE was $0.269. However, this point had previously acted as a barrier when the bulls wanted to push through.
BAT/USD Four-Hour Chart
Basic Attention Token had experienced a strong pullback from the 78.6% Fibonacci level, and ever since that, the coin has mostly displayed mundane price action.
However, over the last 24 hours, the coin soared 10% and was priced at $1.17. At this price level, the coin was trading quite close to the long-holding support level of $1.00. A fall below $1.17 could push the coin to trade near that level or even lower than that.
The Relative Strength Index was bullish as prices also rose, and hence, buyers found a reason to get back into the ecosystem. The Directional Movement Index also preferred the bulls as prices rose. It signaled a rise in buying strength; the Average Directional Index was quite weak as the indicator stood below the 25-mark.


