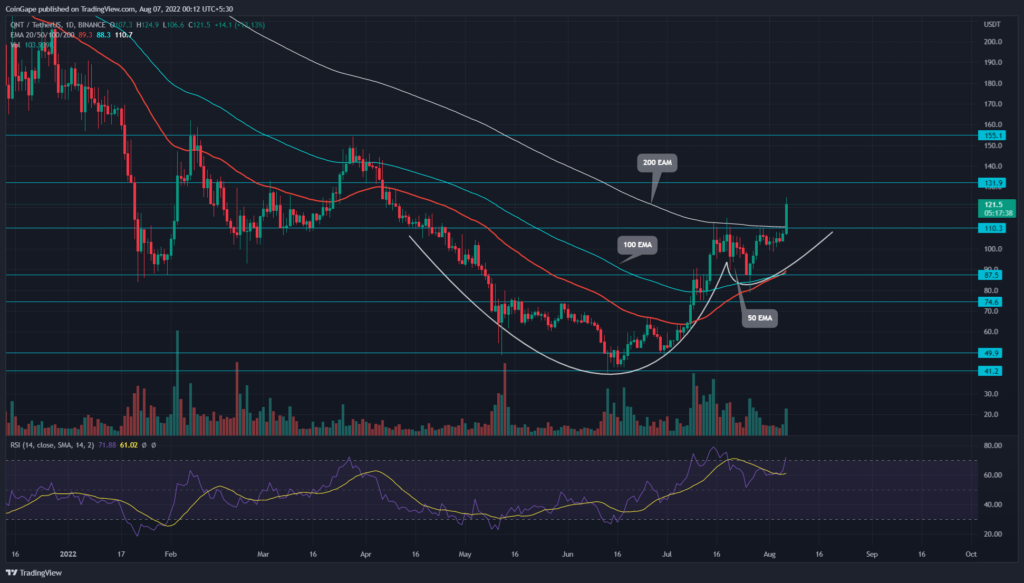
The recent V-shaped recovery in QNT price from $87.5 support formed the handle portion of the cup and handle pattern. This bullish reversal pattern shows its neckline resistance at the $110 mark. Today’s decisive breakout backed by a strong volume spike calls for further advancement for a recovery rally.
advertisement
Key points:
- The $132 supply zone may stall the QNT’s potential rally
- Coin buyers regain the 200-day EMA
- The intraday trading volume in the Quant is $76.2 Million, indicating a 196.2% loss
Source-Tradingview
The July first half parabolic rally has completely offset the May-June downfall as prices hit the $110 resistance on July 15th. As a result, the QNT/USDT pair has registered a 167.3% gain in just one month.
Later, the coin chart witnessed multiple higher price rejection candles at $110 resistance, indicating the profit-booking from short-term traders. Therefore, the selling pressure triggered a minor pullback and tumbled the price by 20% before reverting back to the $110 barrier.
Trending Stories
However, this minor pullback shaped the QNT price into a cup and handle pattern. Today, the coin price witnessed a significant inflow and spiked 13.4% higher to reach $112. As a result, the buyers experienced a massive breakout from $110 neckline resistance.
This bullish breakout triggers the cup and handle pattern to reinform further price recovery. Furthermore, a candle closing above this level would allow buyers to test this breached level for suitable footing.
If QNT price shows sustainability above the $110 level, the potential rally should breach the in-between resistance of $132 and surge 27.5% higher to the $155 mark.
Technical Indicator
EMAs: the crucial EMAs(20, 50, 100, and 200) give two bullish signals, i.e., a bullish crossover of the 50-and-100-day EMA and the price breakout from the 200-day EMA to give additional confirmation for the $110 breakout.
advertisement
RSI indicator: The daily-RSI slope jumps above the 70% mark and indicates strong bullish momentum. However, the indicator nearing the overbought region may threaten a minor correction.
- Resistance level- $96 and $110
- Support levels- $74 and $87.6


