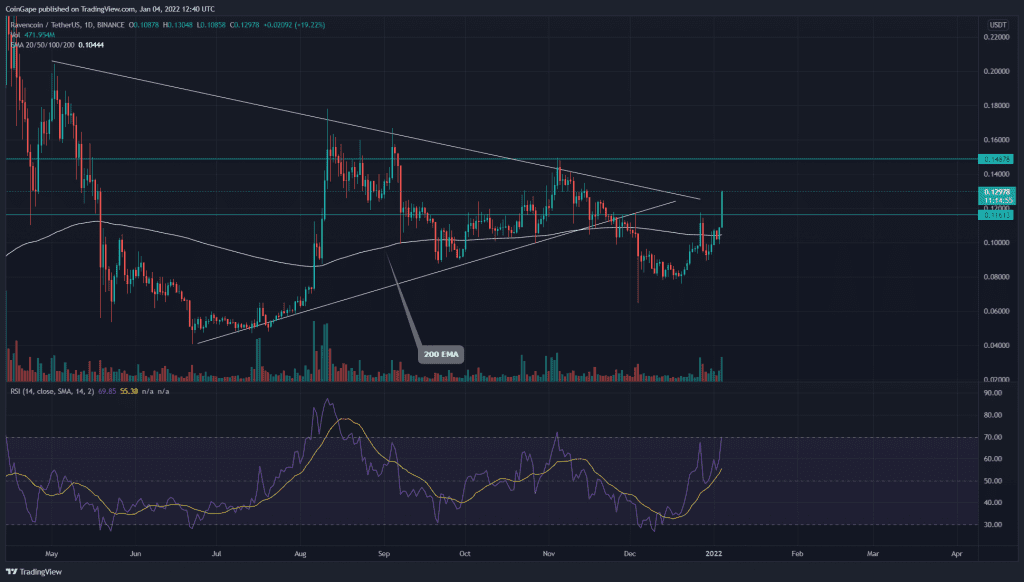
The overall trend for Ravencoin (RVN) is still sideways. However, the price has initiated a new rally which has again around 65% from the last swing low(0.078). Moreover, a cup and handle breakout suggests even more potential in this rally.
Source- Tradingview
Past Performance in RVN coin
On November 26th 2021, the Ravencoin price breached the support trendline of a symmetrical triangle pattern. This breakdown triggered strong selling pressure, which dropped the price to $0.078 support.
The pair spent two weeks trying to sustain above this level. As the new year approached, the coin started to rally again and has given a decisive breakout from the $0.116 resistance level.
Ravencoin Could Pullback To Retest The $0.116 Resistance

Source- RVN/USD chart by Tradingview
The 4-hour technical chart showed an evident cup and handle pattern. With today’s massive bullish candle, the price breached the $0.116 neckline, supported by a significant pump in the volume activity.
The price is expected to retrace to this new support in search of sufficient demand. The crypto traders should watch RVN price action near this level to spot an entry opportunity for a long trade.
By the press time, the RVN coin is trading at $0.127, with an intraday gain of 19.6%. The 24hr volume change is $299.1 Million, indicating a 342% hike. According to Coinmarketcap, the coin stands at 79th rank with its current market cap of $1.32 Billion(+19.6).
Technical Indicators- RVN Coin
- The daily Relative Strength Index(69) shows a parabolic rally approaching the overbought zone in its chart.
- The new recovery rally has reclaimed the crucial EMAs(20, 50, 100, 200), indicating a bullish trend. These EMAs levels would act as valid support during the occasional pullbacks
- The traditional pivot shows remarkable confluence with the daily RVN/USD chart level. According to these pivot levels, the crypto traders can expect the nearest resistance at the $0.1480 resistance at $0.158. As for the opposite end, the support levels are $0.116 and $0.103.


