The RSR token indicates a steady growth in its technical chart, making clear higher highs and lower highs of an uptrend. This new rally provides a box of opportunities for crypto traders, as the price is currently preparing for the next jump after bouncing from significant support.
Key technical points:
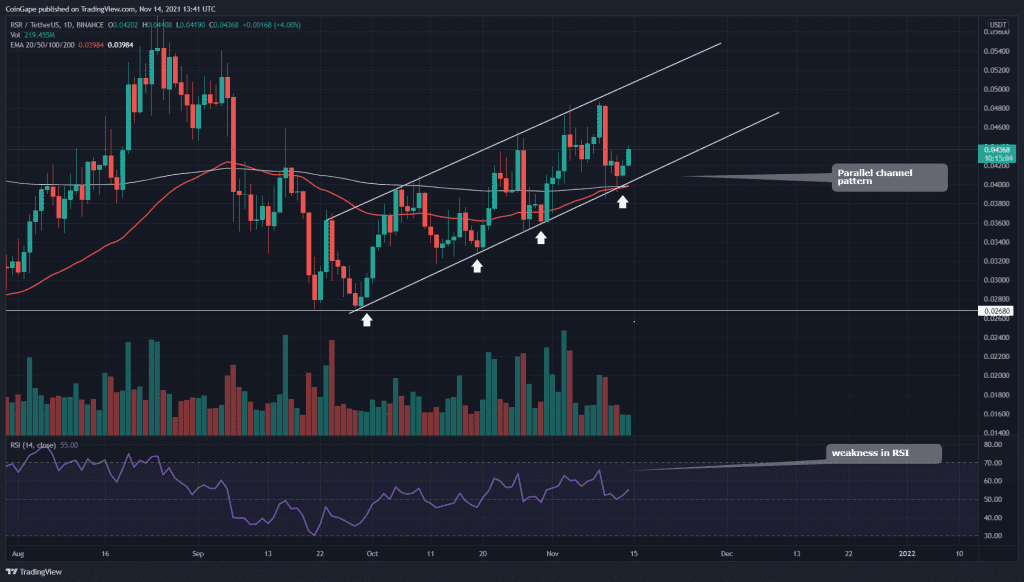
- The RSR token gives a golden crossover of the 50-and-200-day EMA
- The RSR chart forming a rising parallel channel
- The intraday trading volume in the RSR token is $38.4 Million, indicating a 13.9% hike
Source- RSR/USD chart by Tradingview
The RSR technical chart displays an excellent trading opportunity with a parallel channel pattern in the daily time frame chart. The token’s price action has already respected the pattern’s levels multiple times, indicating a reliable pattern to take some sniper trades.
Currently, the token price is taking support from the ascending trendline, indicating a reasonable possibility of the price rising back to the overhead resistance, which is about 18% up. Moreover, the token chart also displays a golden crossover of the 50 and 200 which should encourage more buyers in this token.
The Relative Strength Index value is at 55 has also indicated a decent recovery in its chart. However, it seems the RSI line is struggling to keep up the momentum in this bull rally.
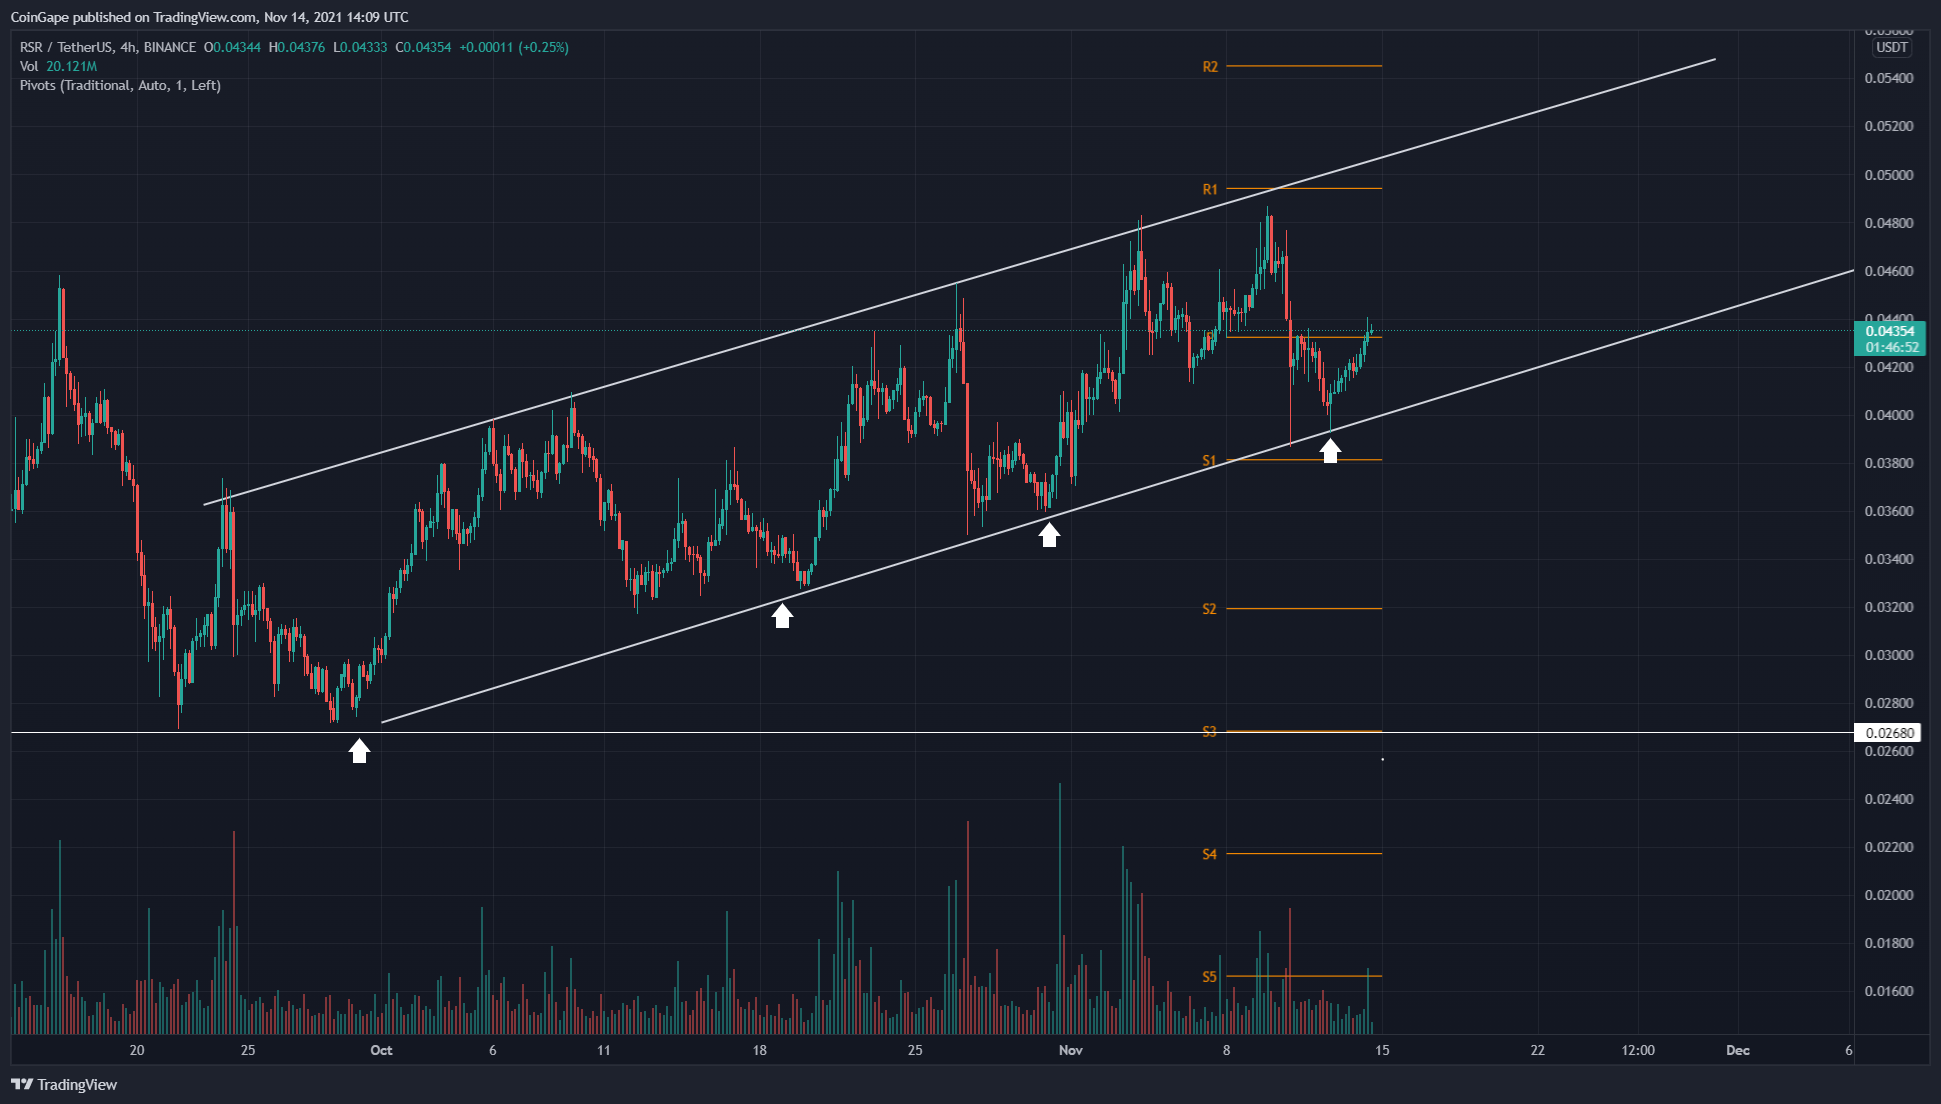
RSR/USD Chart In The 4-hour Time Frame

Source- RSR/USD chart by Tradingview
The crypto-traders should also know that a rising pattern channel also holds an excellent selling opportunity when the price breaks down from the support trendline. The observed weakness in the daily RSI is an early sign of price could give a breakdown from ascending trendline in the near future.
However, until the token price resonates in the parallel channel, the RSR traders can maintain a bullish sentiment. Moreover, the traders can mark the traditional pivot levels in their chart, which shows a remarkable confluence with the token’s important levels.


