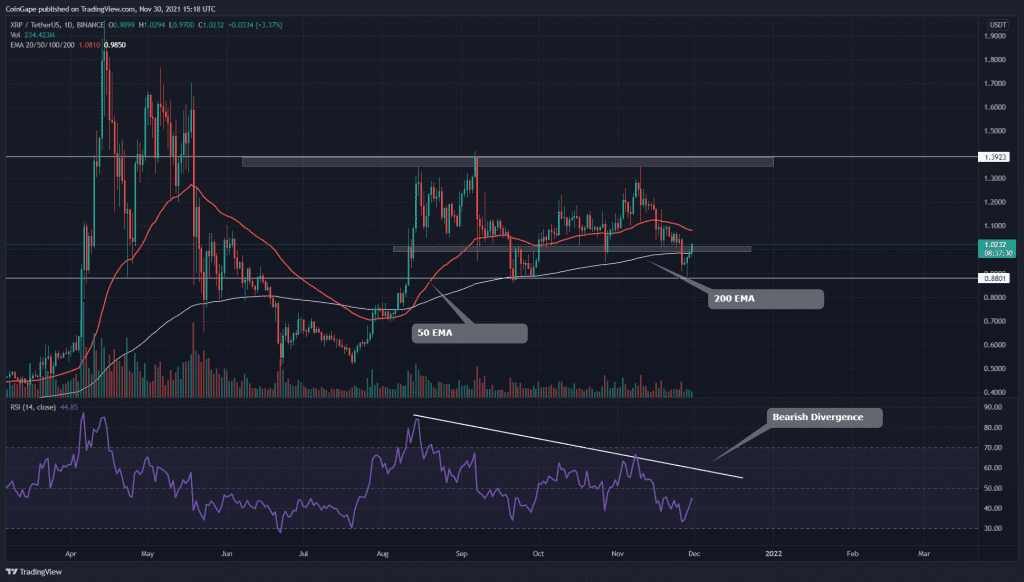
The XRP coin is currently in a short-term sideways trend. The coin price has recently rejected from the overhead resistance of this range and has plunged back to the bottom support of 0.88. However, The technical chart and indicators suggest a positive turn for them coin
Key technical points:
- The XRP coin price action forms a consolidation range in the daily chart.
- The 200-day EMA line is providing constant dynamic strong support to the coin price.
- The intraday trading volume of the XRP coin is $1.5 Billion, indicating a 70.25% gain.
Source- XRP/USD chart by Tradingview
The XRP coin price consolidates within a range as it resonates within the $1.40 and $.088 mark, as shown in the price chart. However, despite multiple breaches, the support zone near the $1 mark acts as a crucial support zone, and the breakout above it can be an excellent entry opportunity for traders.
The 200-day EMA coincides with the $1 support zone providing multiple factors to bring a bullish reversal. However, the price is below the 50-day EMA, which is falling to give a bearish crossover with the 200 days EMA.
The Relative Strength Index(44) continues to move in a downtrend after facing rejection within the overbought zone. Nonetheless, the recovery in the slope from the oversold territory brings bullish indications.
XRP/USD Chart In The 4-hour Time Frame

Source- XRP/USD chart by Tradingview
The falling XRP prices show huge potential for a bull run as it breaks above the resistance trendline of the falling channel in the 4-hour chart. Hence, once the prices are stable above the $1 mark, we can observe the price jump to the $1.40 mark.
However, traders need to be careful with the pivot points showcasing resistance levels at the $1.06 and $1.16 mark. Moreover, on the flip side, the support levels are at the $0.97 and $0.87 mark.


