2021 saw the competition for top ten in the crypto market according to market value get intense. This intense competition saw XRP slide down to the 8th position at the close of the year after holding the third position for long. December 2020 SEC vs. Ripple lawsuit could be credited for the big blow that the international remittances token has suffered for the better part of 2021.
It is worth noting that is becoming extremely difficult to maintain the same position as smaller tokens keep bolting uphill as investors continue to diversify.
Ripple price is teetering around $0.8272 at the time of writing boasting a market cap of $39.37 billion.
Ripple Price Forms a Rectangle Pattern in a Horizontal Price Action
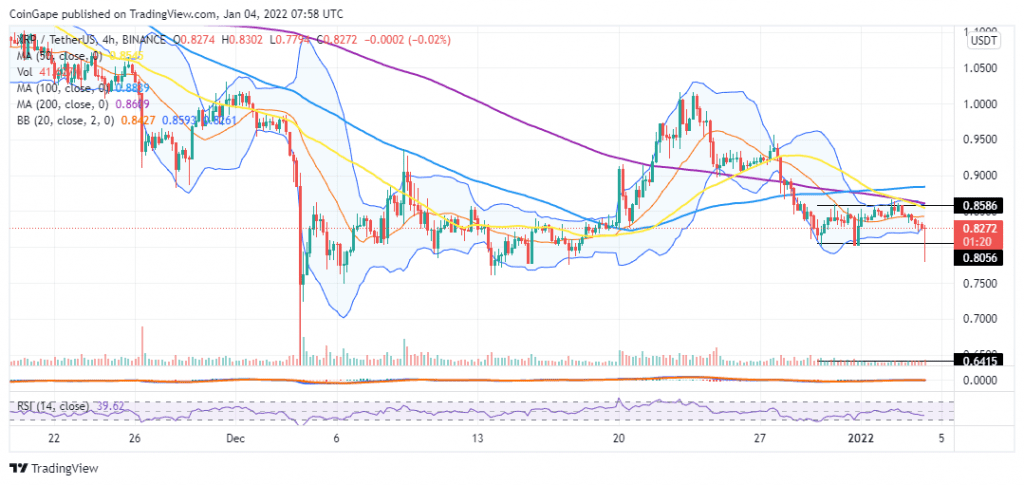
Since December 29, XRP has been trading sideways between the $0.8056 and $0.8586 price range. After falling below the $1.0 psychological level on December 23, price correction began that saw bears regain control of the market flipping the 50, 100 and 200 Simple Moving Averages (SMA)s from support to resistance. This represents a 18% drop from a high of $1.061 on December 23 to the current price around $0.8272 in a sideways price action forming a rectangle chart pattern.
Note that the narrowing of the Bollinger Bands indicate that the XRP price is consolidating. This means any underlying pressure to push XRP upwards will be cancelled by the overhead pressure. If this happens, Bitcoin might continue trading below the $0.90 over the next few days.
The sideways price action is also validated by the horizontal movement of the Moving Average Convergence Divergence (MACD) as well as the leveling of the transaction volume as shown on the four-hour chart. This shows that shows that bulls and bears are canceling out.
XRP/USD Four Hour Chart
Note that the rectangle pattern does not have a defined bullish or bearish breakout, but breaking above the upper boundary of the rectangle around $0.8586 will predict a bullish move for Ripple.
Ripple seems to be battling immediate resistance around the $0.8334 level. For a bullish move to be confirmed, XRP price must close the session above this level and go above the $0.8440 level. This coincides with the middle boundary of the Bollinger Band (BB).
A decisive bullish breakout will be achieved if XRP overcomes the $0.8586 resistance posed by the middle boundary of the rectangle after which a move towards regaining the $0.90 level will be the next logical move.
On the flipside, if XRP closes the day below the immediate support at $0.8255 could see the bulls retreat to re-test the $0.8189 and $0.8056 support levels embraced by the lower boundary of the BB and the lower boundary of the rectangle respectively.


