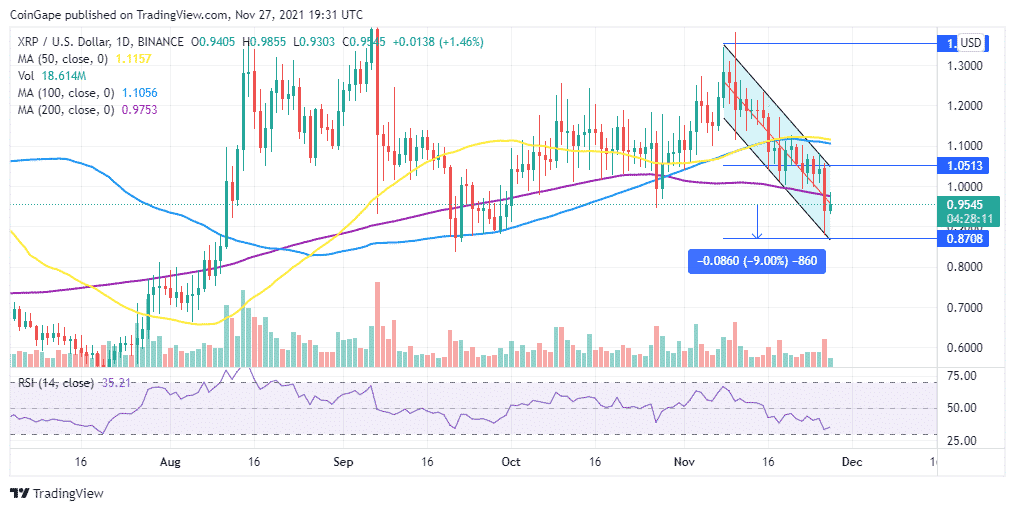
Ripple price dropped below the $1.0 psychological level on November 26, unravelling a possible bearish forecast. The descending parallel channel chart pattern suggests that Ripple could see a 9% drop. To invalidate the pessimistic outlook, XRP would need to overcome the 200-day SMA resistance.
Ripple price fell below the $1.0 psychological level on November 26, paving the way for further losses. The bulls of the international remittances token are struggling to keep their heads above the water as overhead pressure mounts.
Ripple Price Could Drop To $0.8708
XRP price is trading at middle boundary of the descending parallel channel around $0.9545 as seen on the daily chart. A descending parallel channel is a significantly bearish chart pattern that suggests a continued bearish leg as long as the price of an asset remains within the confines of the falling channel.
For XRP, the descending channel chart pattern points to a 9% downswing from the current price to tag the lower boundary of the channel at $0.8708.
The down-sloping moving averages and the position of the Relative Strength Index (RSI) indicator at 36.06 close to the oversold region suggest that Ripple is firmly in the hands of the bears, accentuating this bearish outlook.
XRP/USD Daily Chart
On the upside, the bearish thesis could be invalidated if XRP price overcomes the immediate resistance at $0.9753 embraced by the 200-day Simple Moving Average (SMA). If this happens, Ripple price may potentially unto the losses that began on November 08 by breaking out above the upper boundary of the prevailing chart pattern at $1.0513.
However, any movement further could be inhibited by stiff resistance from $1.1056 and $1.1157 where the 100- and 50-day SMAs lie respectively.
Ripple bulls would need support from the wider market to overcome these hurdles which may see the XRP price pushed higher towards the peak of the descending parallel channel at $1.3542.


