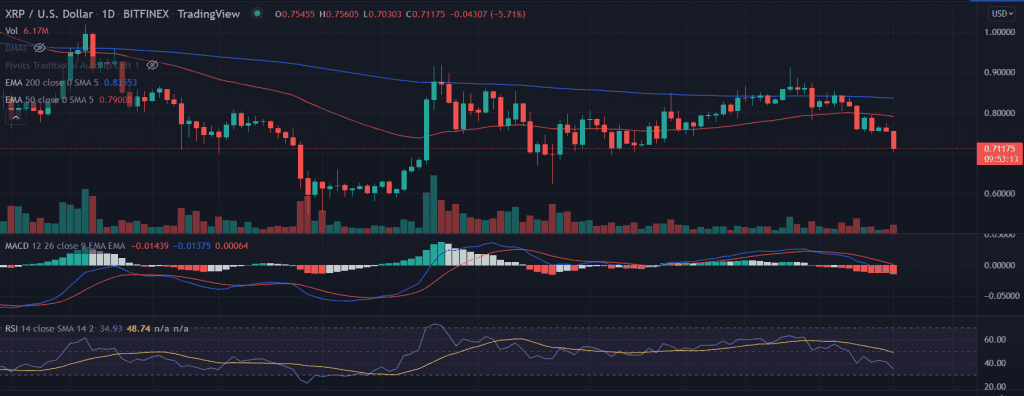
XRP price extends the previous week’s decline and depicts a resurgence of bearish momentum as it slides below the critical area of support. The downside comes as the price slides below the critical moving averages, and is currently resting near a key area where buying could emerge if the buyers are able to hold the level.
- XRP fell as the fresh trading week begins indicating selling pressure.
- Investors can expect XRP to see further retracement toward $0.65 as downside pressure begins to surge.
- Multiple-support near $0.70 looks vulnerable to break.
XRP price trades with a negative bias
XRP price remained in a short-term consolidation since February 9 and formed a “Double Top” formation around $0.91. As a result, the XRP price retraced nearly 45%, breaching the consolidation range.
Now, the price holds near the inflection point if breaks below more selling could be experienced in the asset.
Earlier, the XRP price found reliable support around $0.60 and witnessed an impressive rally of 51% to the swing highs of $0.91.
Sustained selling pressure will drag the price toward the lows last seen in late January at $0.60.
On the flip side, a daily candlestick above $0.75 would invalidate the bearish outlook on the price. In that case, the immediate upside is found near the 50-day EMA (Exponential Moving Average) at $0.80. In addition to that, an acceptance above the 200-day EMA would recapture the March 28 highs of $0.91.
As of publication time, XRP/USD is exchanging hands at $0.71, down 5.61% for the day. The sixth-largest cryptocurrency by the market cap is holding a 24-hour trading volume of $1,904,425,826 as per the CoinMarketCap.
Technical indicators:
MACD: The Moving Average Convergence Divergence drops below the midline with an increased downside momentum.
RSI: The daily Relative Strength Index approaches the overbought zone.


