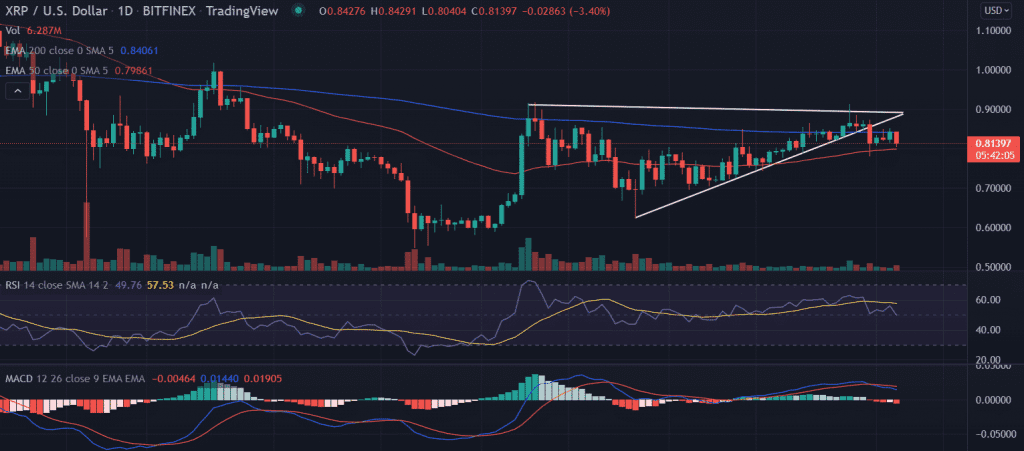
XRP price started the first week of the April series on a lower note. The price remains pressured below the critical 200-day EMA. Now, the price is trading in a very tight range sliced between the 200-day and 50-day EMA at $0.85 and $0.80 respectively.
- XRP price trades lower with significant losses on Monday.
- A break below the 50-day EMA could drag the price further lower toward $0.75.
- The upside remains pressured below the 200-EMA.
XRP Price trades on the bearish edge
On the daily chart, the XRP price fell after failing to hold the psychological $0.85 level. XRP price traded inside the ‘Symmetrical’ triangle pattern since February 8. Finally, the triangle produced a bearish breakout ruining the possibility of $1.0.
Currently, the price hovers near the 50-day EMA (Exponential Moving Average) at $0.80. Now, if the price slipped below the moving average then it would further intensify the selling of the token. The immediate downside target is placed at $0.75.
On the contrary, a shift in the bullish sentiment along with the breach of the 200-EMA would revive the hopes for the bulls. To continue with the upside gains once again, the XRP price must give a daily close above the critical $0.90 level.
Next, market participants would keep their eyes on the highs of December 23 at $1.07.
As of publication time, XRP/USD is trading at $0.81, down 3.83% for the day. The eight-largest cryptocurrency’s 24-hour trading volume is standing at $1,790,237,181 as per the CoinMarketCap.
Technical indicators:
RSI: The daily Relative Strength Index slipped below the average line on March 31. Any downtick in the indicator would strengthen the bearish outlook on the price. Currently, it reads at 51.
MACD: The Moving Average Convergence Divergence trades above the mid-line but with a negative bias. The bearish momentum is picking up indicating more downside.


