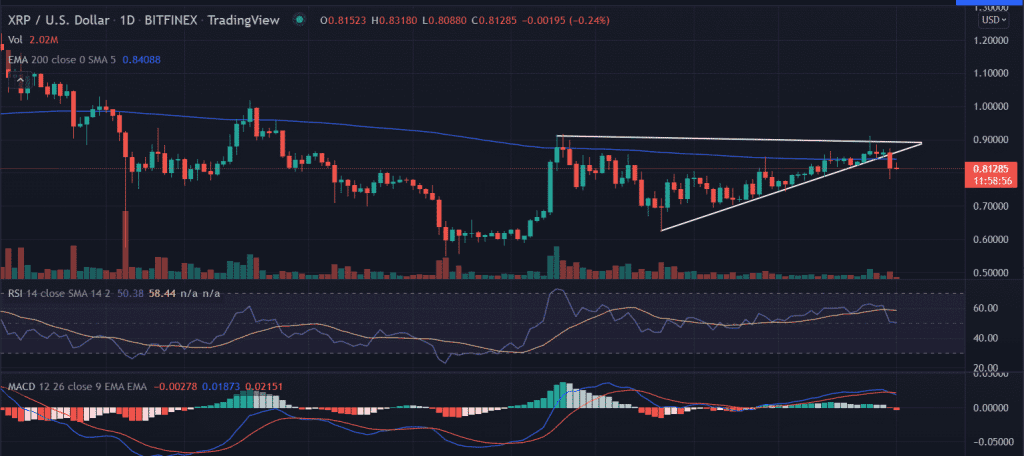
XRP price trades lower with the previous sideways movement. Investors remain cautious of making aggressive bids as the asset trades near the inflection point.
- XRP price continues to trade with a negative bias.
- Expect more downside below the 200-day EMA at $0.85.
- A downside breakout of the ‘Symmetrical triangle’ will dictate the next trend.
XRP looks for a bearish reversal
On the daily chart, the XRP price slips below the crucial 200-EMA (Exponential Moving Average) at $0.84. Now, it holds around the reliable support placed at $0.80. Looking at the previous trend, the XRP price glides inside the ‘Symmetrical triangle’ formation after testing the lows of $0.62 in late February.
Now, if the price breaks the mentioned support level, then it will dive toward the horizontal $0.70 level. Further, intense selling pressure could pull toward the lows of February at $0.62.
On the contrary, a daily close above the 200-EMA amid a shift in the bullish sentiment would invalidate the bearish outlook of the pair. The first upside target could be found at the psychological $0.90 mark.
Next, market participants would approach the highs of December 23 at $1.01.
XRP price tested the record lows in late January at $0.54. The price surged nearly 68% to the swing highs of $0.91. Since then, XRP is gliding inside the ‘Symmetrical triangle’ formation. The next move will depend upon the breakout in either direction.
As of press time, XRP/USD is trading at $0.81, down 0.07$ for the day. The seventh-largest cryptocurrency by market cap is holding a 24-hour trading volume of $2,966,986,477.
Technical indicators:
RSI: The daily Relative Strength Index fell below the average line. However, it reads at 50 with a neutral bias.
MACD: The Moving Average Convergence Divergence although holds above the midline. The indicator signifies the receding bullish momentum.


