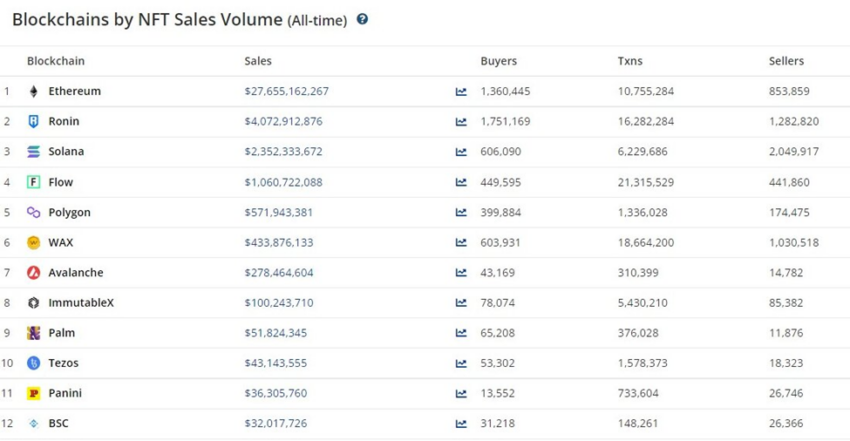
Ronin reached a new milestone in the non-fungible token (NFT) space trailing only Ethereum as the biggest blockchain by all-time sales volume.
Ronin is one of the most popular blockchains when it comes to play-to-earn games that involve the buying, holding, and selling of digital collectibles.
Sky Mavis, the company behind the wildly popular play-to-earn game Axie Infinity, created Ronin in 2020 after realizing Ethereum’s base layer was too slow and expensive to handle the transactions required to power the game.
According to Be[In]Crypto research, Ronin had a total sales volume of approximately $4.07 billion as of June 5.
This comes as a massive boost to the entire Ronin ecosystem after its coin, RON, plunged to new high lows in the market crash of May. This led to market capitalization falling below $70 million.
This landmark puts Ronin ahead of Solana, Flow, Polygon, WAX, Avalanche, Immutable X, Palm, Tezos, Panini, and Binance Smart Chain (BSC).
What caused rise in Ronin sales volume?
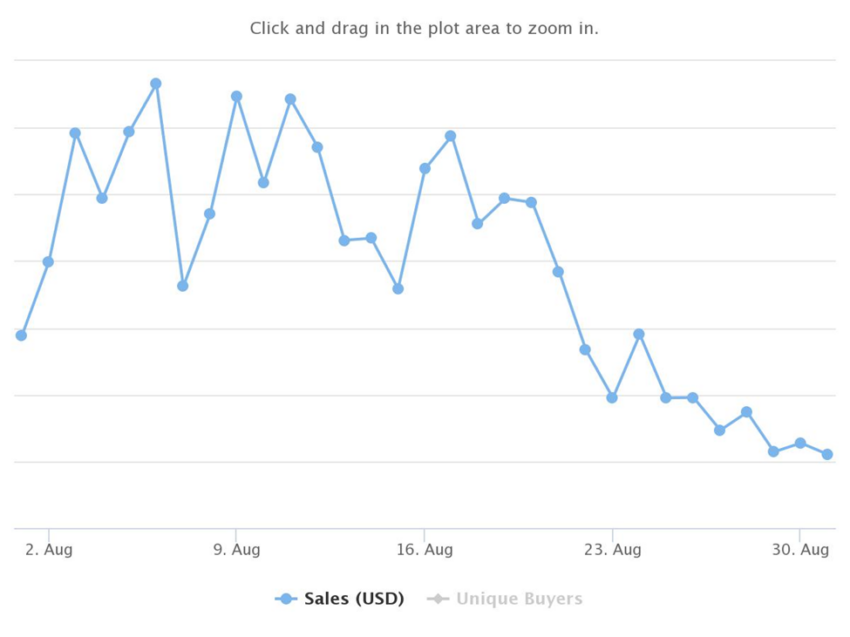
Looking at the spike in the number of unique buyers from Aug, the increase in sales led to the chain’s soaring total transaction counts, with 305,127 unique buyers and 1,853,437 transactions.
The same period was Ronin’s all-time high in monthly sales volume with around $848.24 million.

Most of this volume came from the biggest play-to-earn game, Axie Infinity. Other months that made significant contributions to Ronin sales were July ($666.17 million), Sept ($518.87 million), Oct ($545.79 million), and Nov 2021 ($754.76 million).
RON price reaction
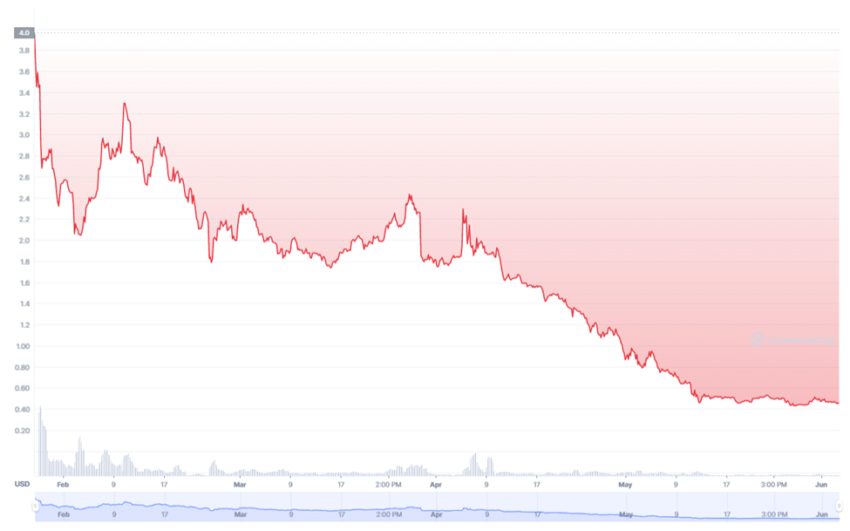
RON became a crypto trading asset in Jan 2022. It opened on Jan 27 at $3.56, reached an all-time high (ATH) of $4.32 the same day, and tested a low of $0.4275 on May 27.
At the time of writing, the coin’s price was $0.4700. Overall, this equates to an 87% decline throughout 2022.

Disclaimer
All the information contained on our website is published in good faith and for general information purposes only. Any action the reader takes upon the information found on our website is strictly at their own risk.


