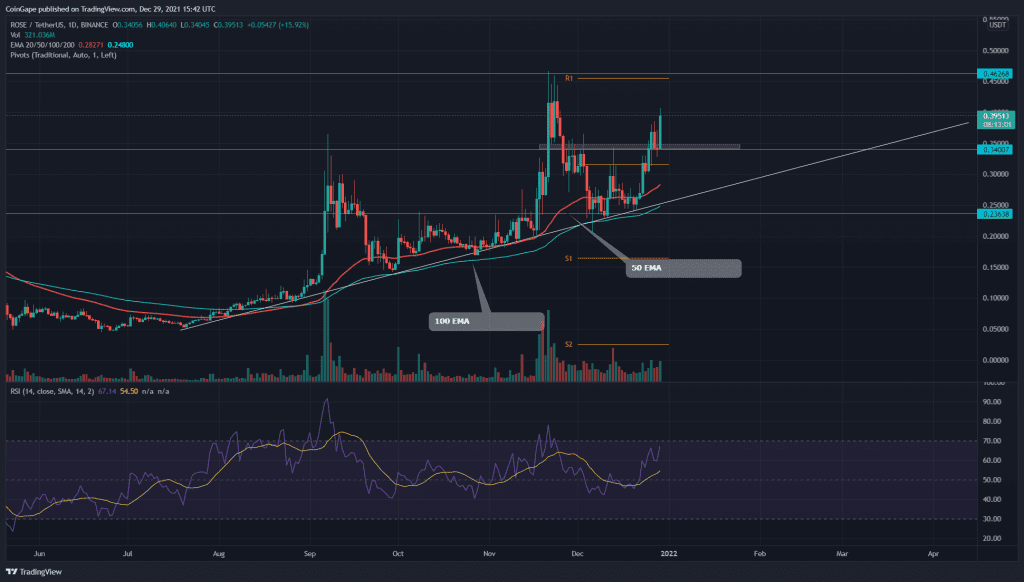
The Oasis Network coin shows an overall uptrend in its technical chart. The pair shows impressive recovery from its last retracement phase, where it has rallied 50% from the new higher low level. The price recently reclaimed $0.34 mark should bolster the price to reach the ATH resistance of $00.46.
ROSE/USD Daily Time Frame Chart
Source- Tradingview
Past Performance in ROSE coin chart
The Oasis Network coin initiated a new uptrend from late July. Since then, the coin has marched an upwards rally led by an ascending trendline. The trendline has provided multiple support to the price, and the crypto traders can maintain a bullish sentiment until this line is intact.
The recent retracement in the ROSE coin brought a 55% discount in its value by dropping it to the $0.236 support. This point was a strong area of interest of the buyers due to the confluence of major technical levels, like 100 EMA, rising trendline support, and an important horizontal level.
Oasis Network Coin Forming A Rounding Bottom Pattern
Source-Tradingview
The ROSE coin price formed a double bottom pattern with the base support of $0.236. On December 26th, the price breached the $0.34 neckline for this pattern, providing a long trade opportunity for traders.
Today, the price completed a morning star candle for its retest. Furthermore, the 4-hour time frame chart shows a rounding bottom pattern, which could lead the price to the All-Time High resistance of $0.46 and maybe even beyond it.
By the press time, the ROSE coin is trading at $0.4, with an intraday gain of 17.56%. The 24hr volume change is $324.4 Million, indicating a 68.5% hike. According to Coinmarketcap, the coin stands at 79th rank with its current market cap of $1.4 Billion(+12.5).
Technical Indicators
- -The daily Relative Strength Index(67) shows a strong recovery from the oversold area, crossing above the neutral level(50).
- – The 50 and 100 EMA lines are majorly covering for the occasional pullback in this uptrend/
- -The traditional pivot shows remarkable confluence with the daily ROSE/USD chart level. According to these pivot levels, the crypto traders can expect the nearest resistance at the $0.45 resistance at $0.6, followed by $0.6. As for the opposite end, the support levels are $0.31 and $0.166.


