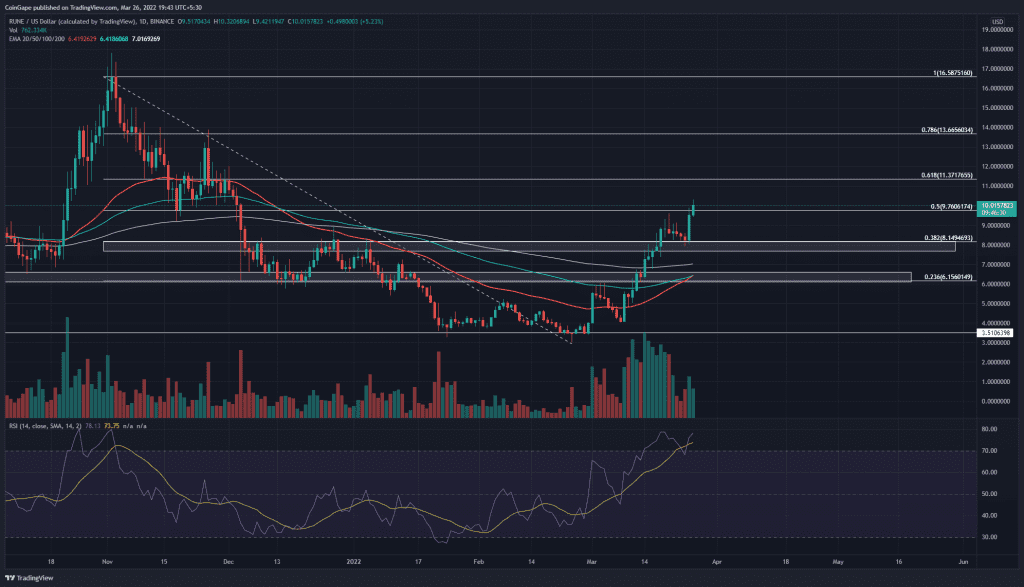
The surging ThorChain(RUNE) price approaches the psychological mark of $10 after making multiple bullish engulfing candlesticks in the daily chart. The rally continues to intensify and showcases a boom in buying pressure, but the higher price rejection shows an active selling pressure which could result in a retracement in the upcoming sessions. Can buyers continue to maintain trend control?
Key points
- The 50 and 100-day EMA performs a bullish crossover.
- The 24-hour trading volume in the Thorchain coin is $383 Million, indicating an 8.34% rise.
Source-Tradingview
The remarkable 20% post-retest rally in the RUNE price from the $8.5 mark approaches the psychological barrier at $10. However, the rally shows a lack of trading volume after the retest compared to the previous bull run from $3 to $8.5.
The present daily RUNE candle shows higher price rejection near the 50% Fibonacci level close to the $10 mark, adding points to the retracement dogma.
That is why, a seller’s victory at the 50% Fib level will ensure a retracement to the following support level of $9.
However, if bulls resurface by any chance and achieve the previous trading volume range, a bullish rally to the $11 mark is plausible.
The technical chart indicates the important supply regions are $10 and $11.35. On the opposite end, the retracement can find demand at $0.163 and $0.12.
Technical indicators
With the remarkable recovery, the EMAs showcase a bullish crossover of the 50 and 100-day, with the 200-day EMA reversing the trend.
The daily-Relative Strength Index showcases a boom in the underlying bullishness, with the RSI slope retesting the overbought boundary to bounce back higher above the 75% mark. Furthermore, the 14-day SMA supports sudden dips and helps maintain the uptrend.


