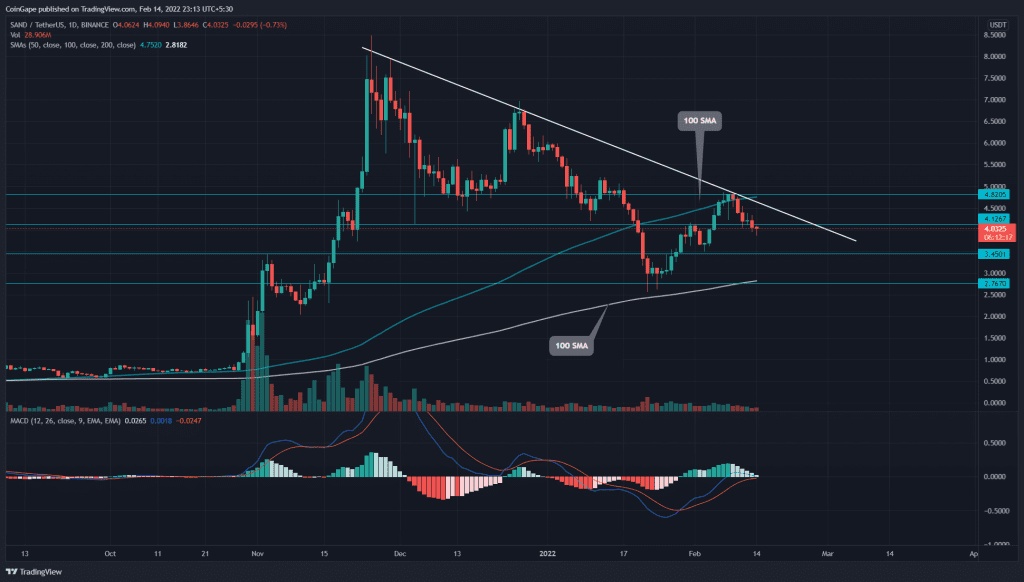
The SAND/USD chart showed an impressive recovery from the $2.76 mark, displaying a 72% ROI. However, the rally couldn’t surpass the descending trendline and rejected to the immediate support of $4.1. If bears sustain below this, the selling pressure would intensify and sink the coin to $3.5.
Key technical points:
- The SAND buyers lost the 20-day SMA support
- The intraday trading volume in the SAND token is $1.3 Billion, indicating a 3.6% loss.
Source- Tradingview
The SAND/USD buyers continued their recovery in February and surged to the $4.8 mark. However, the confluence of several technical levels, i.e., descending trendline, 50 and 100 DMA, mounted stiff resistance at this mark and reverted the altcoin below the immediate support of $4.1.
The coin price currently trading at $4.03 registered a 15.5% decline since last week. The sustained selling could pull the altcoin to $3.5 or 2.76 support, indicating bears are selling on rallies.
The daily-MACD indicator shows the fast and slow line failed to rise above the neutral zone(0.0). A bearish crossover among these lines projects a sell signal for crypto traders.
The down-slopping 50- SMA accentuates the aggressive selling from bears. Moreover, the coin price also slips below the 20-SMA, providing an additional edge to short sellers.
Descending trendline Leads The Minor Pullback
The recent retracement respects a descending trendline to maintain the steady downfall. Until this dynamic resistance remains intact, the SAND price will continue to decline.
By press time, the SAND/USD technical chart shows lower price rejection to the daily candle, suggesting the buyers are trying to defend the $4 psychological level. If they succeed, the buyers would push the pair above the descending trendline and rechallenge the resistance trendline.
- Resistance levels- $3.8, $4.4
- Support levels are $3.3 and $2.7


