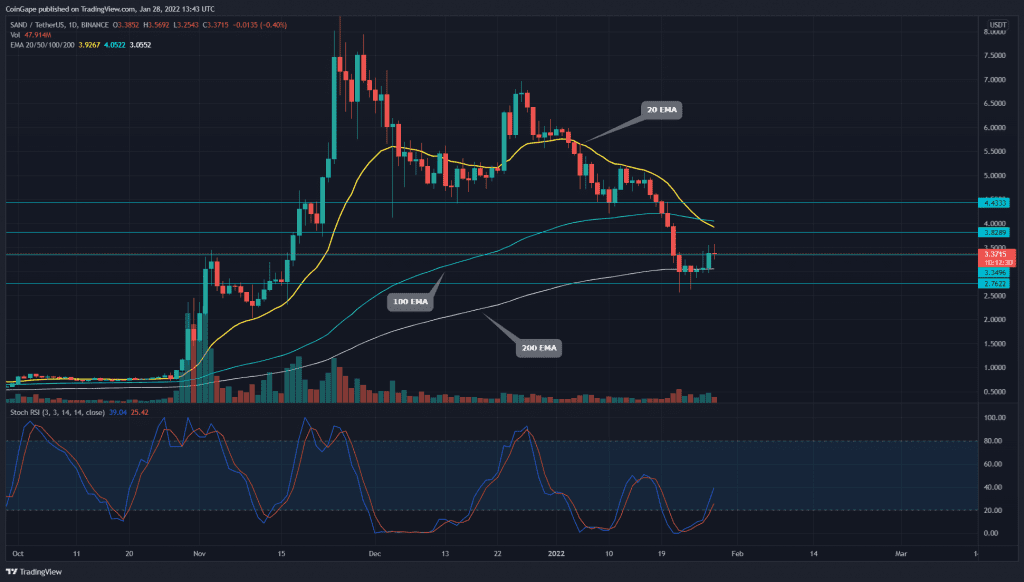
During the retracement phase, the SAND price lost almost 70% from the All-Time High of $8.48. The token price has plunged to $3.3, where the demand pressure near 200-day signals a bullish reversal. Moreover, recent news about Warner Music Group (WMG) entering the metaverse through Sandbox with its Music-centric theme park.
Key technical points:
- The daily-Stochastic indicator shows a bullish crossover among the K and D line
- The intraday trading volume in the SAND token is $1.3 Billion, indicating a 3.6% loss.
Source- Tradingview
In our last coverage on Sandbox technical analysis, the SAND buyers lost the 50% retracement mark($4.4). However, under the influence of bearish sentiment around the crypto-verse, the bear attack continued and dropped the token to $2.75, indicating more 17% devaluation.
- However, the buyers defended $2.75 SAND price mark, and along with the support of 200-EMA, the SAND price bounced back. The SAND/USD pair shows a 30% ROI from the recent low and has managed to reclaim a minor resistance of $3.3, teasing a recovery opportunity.
- The daily-Stochastic RSI providing a bullish crossover of the K and D line is steadily approaching the midline.
- However, the daily technical shows a bearish crossover of the 20 and 100 EMA, luring more sellers to the token.
Inverted H & S Pattern Brings Bullish Opportunity In SAND Price
 Source-Tradingview
The recent recovery in SAND price shows an inverted head and shoulder pattern in the 4-hour time frame chart. The SAND price is currently retesting the $3.3 neckline after a bullish breakout, providing a long entry opportunity for traders.
With the price sustaining this breakout, the SAND/USD pair could rise to the $3.82 mark in the coming week.
The 4-hour moving average convergence divergence offers extra confirmation for this pattern breakout as both the MACD and signal jumps above the neutral zone(0.0)
- Resistance levels- $3.8, $4.4
- Support levels are $3.3 and $2.7


 Source-