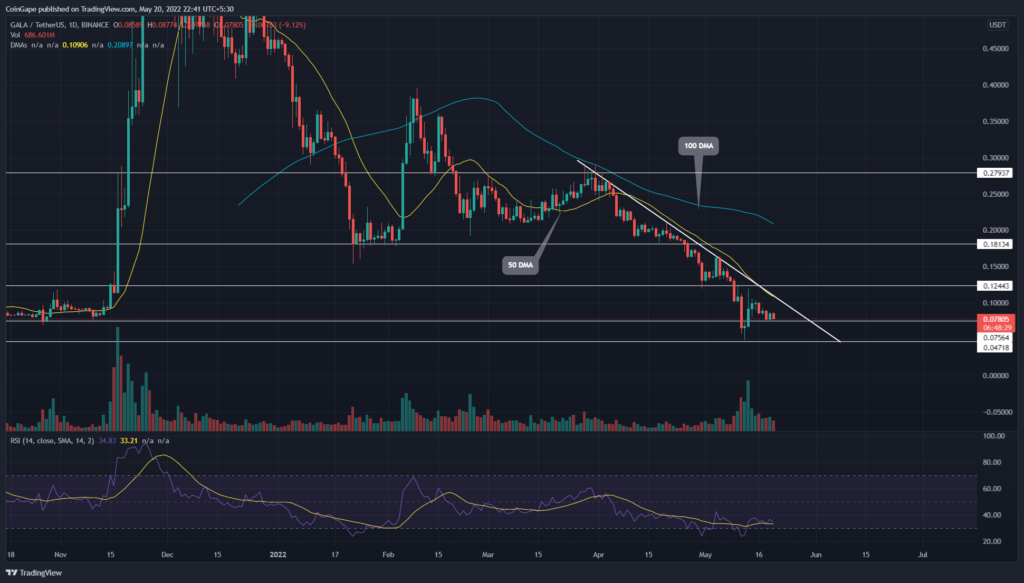
Since the Sandbox(SAND) holders lost the $2.5 crucial support, the coin price has witnessed a steady downfall accentuated by a descending trendline. Moreover, several retests to this dynamic resistance indicate the traders are actively responding to its level. Thus, the interested buyers should wait for trendline breakout to grab a long opportunity.
Key points:
- The SAND price is soon to retest at $1 psychological support
- The 20-day DMA offers constant resistance to SAND price
- The intraday trading volume in SAND price is $1.08 Billion, indicating a 146.3% hike.
Source- Tradingview
For the first four months of 2022, the Sandbox(SAND) buyers had mounted absolute support at the $2.5 mark. However, the formation of new lower lows reflected the weakening of bullish momentum, which eventually breached this bottom support.
The $2.5 fallout support triggered a massive sell-off, and the wide signal of negative sentiment in the crypto market bolstered the downfall to the new lower low of $0.097. Moreover, the post-retest fall registered a 58% loss.
On May 13th, the SAND price rebounded from the $1 mark, suggesting a bullish pullback to the overhead resistance. However, with the bitcoin price failed attempt to sustain above the $30000 mark, this altcoin price reverted and plans to retest the $1.
Trending Stories
Thus, if sellers continue to pressurize the coin price, the SAND holder could lose the $1 mark and be exposed to a 40% loss.
advertisement
Alternatively, a bullish breakout from the descending trendline could signal a recovery sign for SAND buyers and drive the coin price 180% high to $3.62 mark.
Technical indicator
The Vortex indicator maintains a significant gap between the bearishly aligned VI+ and VI- indicator sustained selling in the market.
A strong rise in daily-ADX slope with no weakness indicates steady growth in the bearish momentum.
- Resistance levels- $1.85 and $2.5
- Support levels- $1 and $0.58


