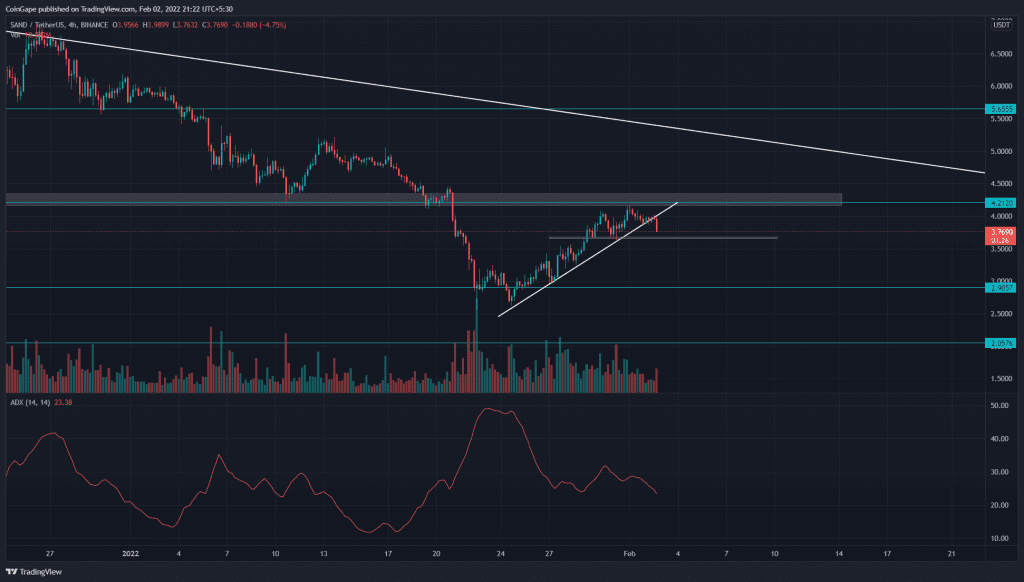
The SAND buyers made an impressive recovery last week which rallied the coin price to $4 resistance. However, the bears defending this mark exert strong selling pressure on the traders. The coin price is likely to retest the currently lower low support of $3 with a possibility to continue the downtrend.
Key technical element to ponder
- The SAND Price shows a daily-evening star candle pattern at $4 resistance
- The intraday trading volume in the Sandbox token is $652 Million, indicating a 29.63% loss.
Sandbox Bears Regain Momentum Tease A 20% Free Gall
Source- Tradingview
The SAND/USD technical chart showed an ascending trendline that supported the bulls during the recovery rally. However, the price action gives a fallout from this support trendline, provides an early signal for downtrend continuation.
The sellers would soon retest a minor support level of $3.6, whose breakdown will give an extra edge to short sellers.
However, The coin price is trading above the 200 SMA in the daily chart, indicating the long-term trend is still bullish. However, the buyers could struggle to overcome other SMA lines(20, 50, 100) if they impose sufficient selling pressure.

Source- Tradingview
In our previous coverage of the Sandbox token, Coingape foretold about the recovery rally to $4, when the SAND price gave a bullish breakout from an inverted head and shoulder pattern. The V-shaped price recovery gained 43% in a week, which currently challenge the overhead resistance.
If buyers could give a breakout and close above the $4 mark, the bulls have a strong chance to reverse the trend. Conversely, the formation of evening star patterns at this resistance indicates the traders are selling the rallies.
Moreover, the Relative strength index(44) presented a strong recovery during the recent price jump. However, the RSI slope failed to cross above the neutral line(50$), suggesting the bearish sentiment is intact.
- Resistance level- $4-4.2 and $5.6
- Support levels- $3.6, $3


