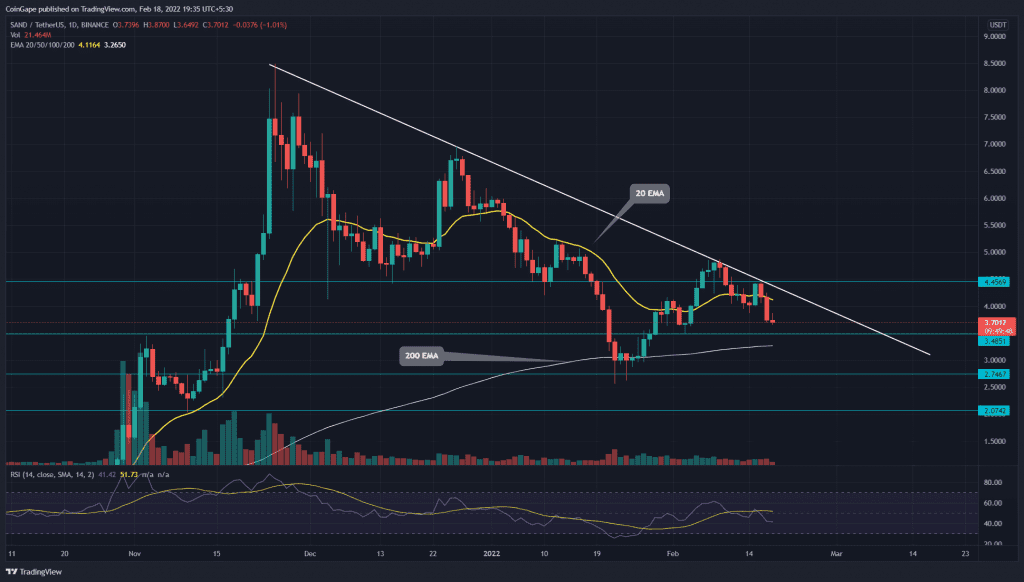
Under the influence of a descending trendline, the Ssandbox (SAND) sellers revert the recovery rally from the $4.82 mark. In less than two weeks, the altcoin lost 25% and plunged below the $4 psychological level. Moreover, the sustained selling threatens the bulls could lose the $3.5 support.
Key technical points:
- The descending trendline breakout is must for genuinely bullish recovery.
- The daily-RSI slope re-enter the negative territory
- The intraday trading volume in SAND price is $987.5 Million, indicating a 4.18% loss.
Source- Tradingview
Since the correction phase began in late November of 2021, the SAND price has respected a descending trendline, pulling the altcoin to its lower level. The recent recovery soared the SAND price by 80% and brought it back to the resistance trendline($4.84).
However, the sellers mounted stiff resistance at this level and triggered a fallout from the $4.45 mark. The bears benefited from this bull trap and reverted the altcoin by 24.5%($3.67).
The flattish crucial EMAs(20, 50, 100, and 200) signal a sideways movement in price action. However, the bearish crossover of the 20 and 100 EMA could boast the ongoing sell-off in the crypto market.
The daily-Relative Strength Index(41) slope slips below the 14-SMA and neutral, indicating aggressive selling from traders.
SAND Price Approaching A Combine Support Of $3.5 And 200-day EMA

Source-Tradingview
The recent retracement from the overhead resistance trendline suggests the sellers maintain a sell-the-rallies sentiment. The altcoin gradually falling will soon retest the shared support of $3.5 and 200-day EMA. If sellers pulled the price lower this support, they can expect a target to the current lower low support of $2.75
Alternatively, if the SAND price rebounds off $3.5 support, the buyers will drive the price to the descending trendline with an expectation of a bullish breakout.
- Resistance levels- $4.45, $5.2
- Support levels are $3.5 and $2.75


