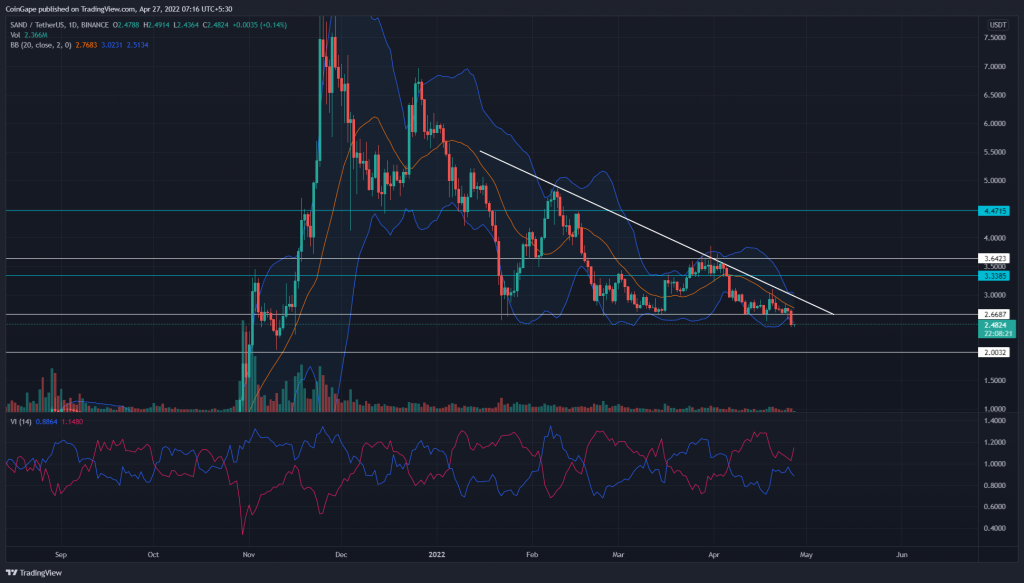
The Sandbox(SAND) price gradually narrowed within the descending trendline and $2.5 crucial support. As the coin price reached the apex, the sellers took a significant lead and breached the support neckline($2.5). The expected retest phase should validate the triangle breakdown, offering a 24% fall towards the $2 physiological mark.
Key points:
- The SAND buyers lost the crucial $2.5 support
- The 20-day EMA offers dynamic resistance to SAND price
- The 100-and-200-day EMA nearing a bearish crossover
- The intraday trading volume in SAND price is $409.6 Million, indicating a 10% loss.
Source- Tradingview
The SAND/USDT technical chart showed a descending triangle pattern in the daily time frame chart. The coin price formed new lower highs within this pattern, reflecting the losing bullish momentum.
Furthermore, the buyers have defended the $2.5 support since last quarter, indicating a strong accumulation zone for traders. However, with the recent sell-off in the crypto market, the SAND price is down by 5% today and breached the bottom support($2.5).
Therefore, a daily-candle closing below this level would project a breakdown opportunity with the post-retest rally to drop 25% lower to $2 psychological support.
Trending Stories
However, even if the SAND sellers couldn’t sustain below the $2.5 mark, the buyers need to breach the dynamic resistance trendline to confirm a bullish recovery.
advertisement
Technical indicator
The Bollinger band indicator accentuated the narrowing range within the triangle pattern. Furthermore, the SAND price breached shared support of $2.5, and the indicator’s lower band provided an extra edge for short-sellers.
The SAND price trading below the downsloping crucial EMAs(20, 50, 100, and 200) projects the sellers have the upper hand.
Moreover, the vortex indicator escapes from a bullish crossover between the VI+ and VI- line and undermines the buyer’s attempt to regain trend control. The increasing gap between these lines suggests strong selling in the market.
- Resistance levels- $2.5,and $3
- Support levels- $2 and $1.5


