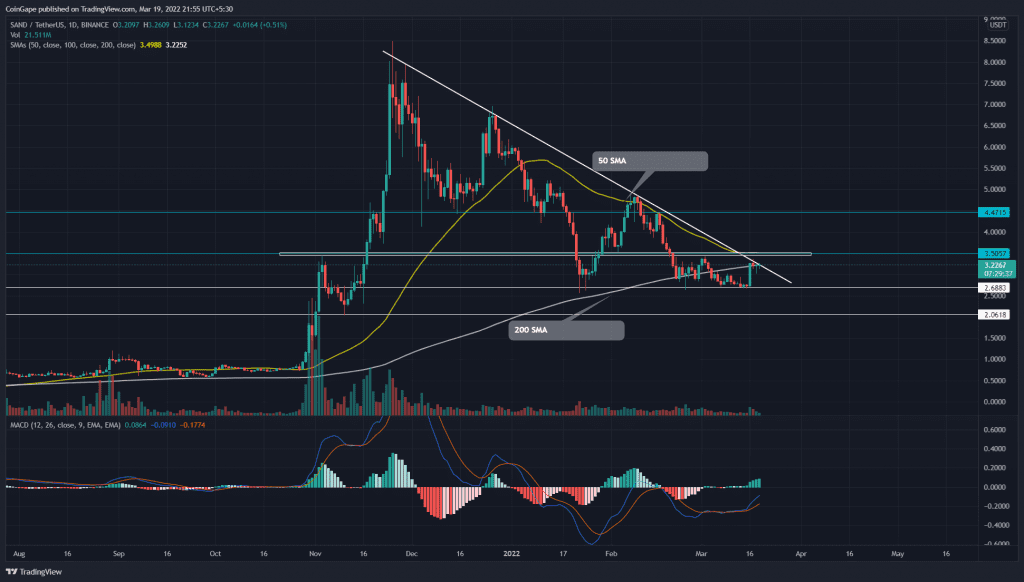
For over a month, the Sandbox(SAND) price has been trapped within the $3.5 and $2.66 levels. However, the recent bull cycle had surged the coin price to dynamic resistance trendline teasing for a bullish breakout. Can buyers breach this overhead resistance, or will sellers dominate the field again?
Key points:
- The SAND price buyers try to sustain above 200-day SMA
- Potential bearish reversal could tumble SAND price by 18%
- The intraday trading volume in SAND price is $825 Million, indicating a 3.29% loss.
Source- Tradingview
On Wednesday, the Sandbox(SAND) price experienced a sudden 21% intraday pump, driving the altcoin to the $3.3 mark. The altcoin has provided multiple restest to this $2.65 monthly support, indicating this level as an important accumulation zone. However, the dynamic resistance remains intact, and the buyers are still struggling to surpass it.
The coin price shows consecutive Doji candles at this trendline over the past three days, indicating indecisive traders’ sentiment. If the price sustains below the descending trendline, the selling pressure would escalate and dip the altcoin back to bottom support($2.66).
Alternatively, a bullish breakout from the descending trendline and $3.5 would replenish the bullish momentum and drive the altcoin to the $4.7 mark.
Technical analysis
With the reversal to the resistance trendline, the MACD and signal lines diverge to regain bullish alignment and continue to approach the central line. Furthermore, the positive trend of bullish histogram gains momentum, indicating an increased chance of trendline breakout.
The bullish revolt rally shows lower price rejection as it struggles to sustain above the 200-day SMA. The rally attempts to avoid the potential bearish crossover that may result in a retracement within the triangle.
- Resistance levels- $3.5, $4.48
- Support levels- $2.68 and $2


