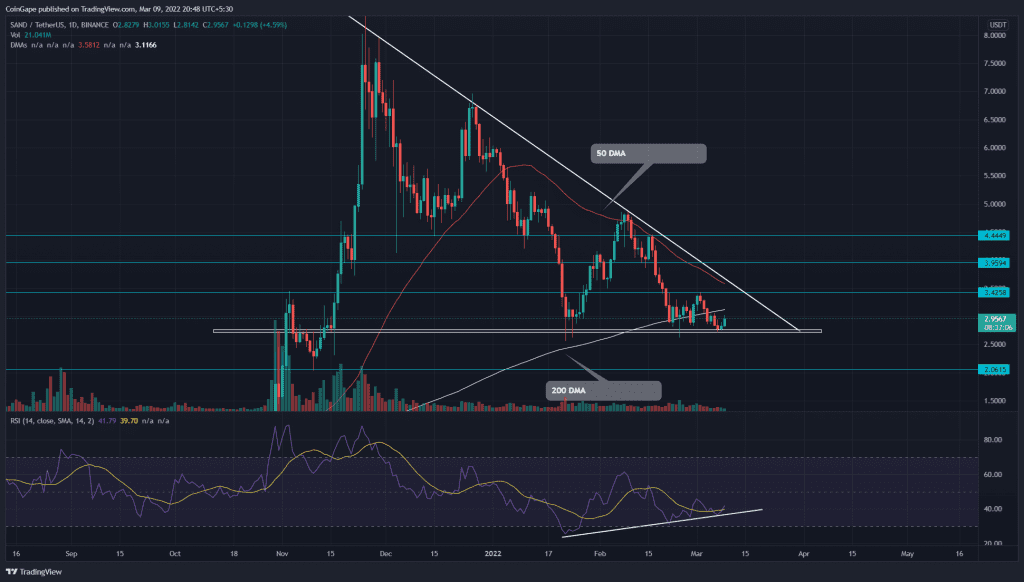
The recent news that US President Biden will be signing an executive order to create a ‘Digital dollar‘ has brought a sudden pump in the crypto market. Following the overall sentiment, the Sandbox(SAND) price bounced back from the $2.74 support, indicating a 4.43% intraday gain. Can traders maintain this bullish momentum to breach the long coming descending trendline?
Key points:
- The 50-DMA provides strong resistance to SAND price
- The daily-RSI shows a positive divergence concerning the SAND price action
- The intraday trading volume in SAND price is $266.5 Million, indicating a 19.44% gain.
Source- Tradingview
The Sandbox(SAND) traders aggressively sell in downtrend rallies using a highly influential descending trendline. The recent reversal from the dynamic resistance plunged the altcoin to $2.73 monthly support.
Last week, the buyers tried to bounce back from this support($2.73) and breached the immediate resistance of $3.42. However, the altcoin couldn’t overcome this overhead resistance and plummeted back to bottom support.
Today the altcoin bounced back from the $2.73 support, suggesting this level as a high accumulation zone. The sustained buying momentum would drive the coin price by 15%, challenging the shared resistance of $3.42 and descending trendline.
A breakout and sustainability above this overhead resistance would indicate the traders’ sentiment has shifted from selling the rallies to buying the dip, predicting a potential recovery to $4, following the $4.4.
Conversely, if sellers sink the altcoin below the $2.73 support, the SAND holders will face a 24% downside risk.
Technical analysis
The daily-Relative Strength Index shows an evident positive divergence concerning the last three swing lows, indicating a possible bullish reversal from the $2.75 mark.
However, the declining 50 and 100 DMA suggest the bear has the upper hand. Moreover, the buyers have recently lost the 200 DMA support, offering an extra edge to short-sellers.
- Resistance levels- $3.42, $4
- Support levels- $2.75 and $2


