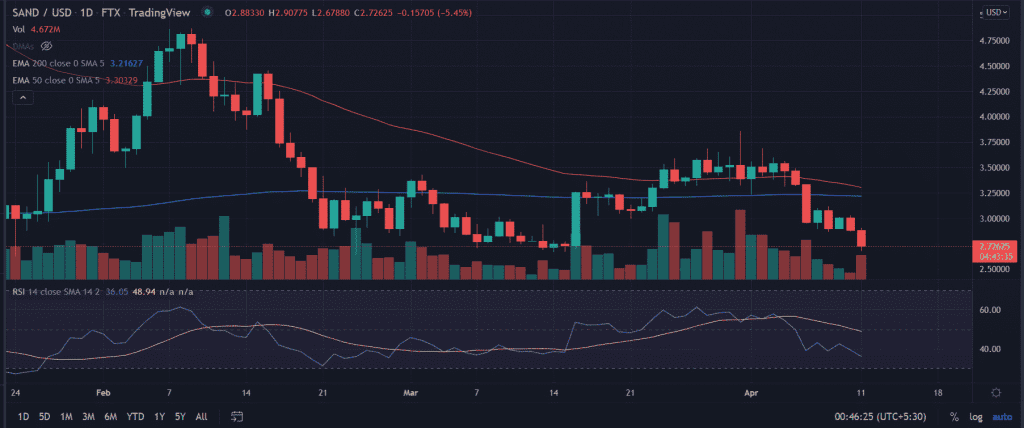
SAND price remains pressured to test fresh daily lows, it sliced below the crucial moving averages signaling a bearish outlook for the token. The recent price action indicates the break of a reliable support area, suggesting impending bearish momentum in SAND.
- SAND price is on a continuous downside spree as it failed to hold key support areas.
- Further, increased selling pressure could propel SAND to drop 15% more from the current levels.
- A reversal in the price on the pre-condition to a daily close above $2.65.
The 24-hour trading volume of SAND holds at $497,269,667 as updated by the CoinMarketCap. As of writing, SAND/USD reads at $2.70, down 6.11% for the day.
SAND price trades negative
SAND price breaches all supply zones, extending from $4.52 to $3.86 since February 9. Further, the price sliced two of the critical moving averages at $3.30 and $3.21 respectively on April 5.
So far, the SAND price had retraced nearly 45% from the highs of $4.86. At the current levels, the price tested the vital support multiple times, giving rise to a triple bottom formation. However, the rising volumes along with declining prices tell a different story.
If the SAND price breaks below the session’s low, it will indicate the persistent selling of the asset. In this case, SAND could revisit the support levels last seen in November at $2.30.
On the other hand, a bounce-back could be expected in the price near the mentioned support zone. A spike in the buy orders could propel the price to recapture the April 6 highs at $3.33. A decisive breakout above the highs would revisit the March 31 high at $3.86.
The daily Relative Strength Index (RSI) is near the oversold zone. Currently, it reads at 35.


