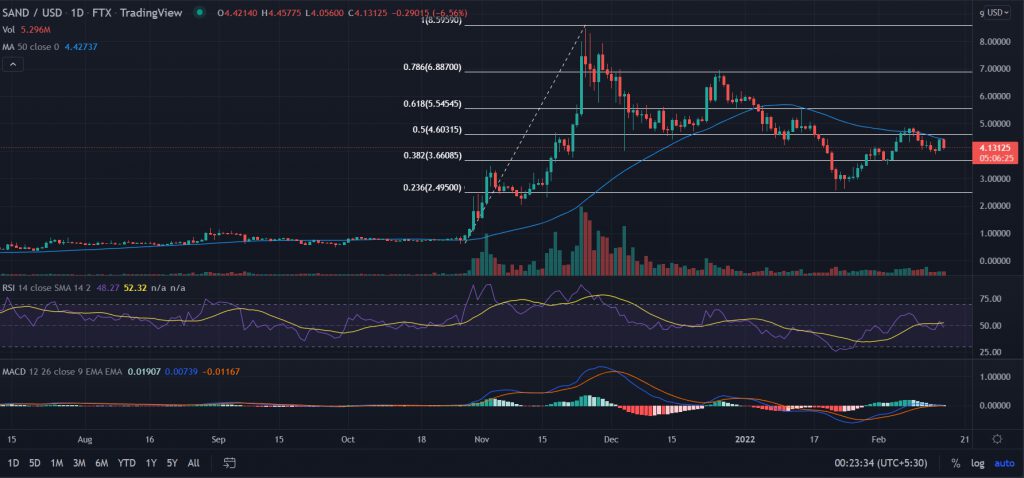
Sandbox (SAND) price trades with negative bias on Wednesday. SAND has faced multiple upside hurdles after surging 55% from January’s lows at $2.56. Furthermore, Sandbox price is in the process to break the downtrend that started in December as Investors are gathering momentum near the lower levels.
- SANDBOX (SAND) price trades on a lower note on Wednesday.
- Expect further upside above the close of 0.5% Fibonacci Retracement.
- However, the downside remains intact below the $3.6 support zone.
Sandbox face stiff resistance near $5.0 on the daily chart
Sandbox price has been trading lower after testing the ATH on November 25 at $8.48. Buyers took some breather toward the 0.5% Fibonacci retracement level at $4.62. Once again price flipped this level while taking an upside ride from the swing lows of $2.56.
Now, SAND bulls need some retracement to break the stiff resistance barrier as it is already remained pressured below the 50-day Simple Moving Average (SMA) at $4.42. The immediate upside target could be found at the 0.618% Fibonacci retracement level of $5.48.
Further, a decisive close above the $6.0 psychological level could see next in line highs of December 26 that is placed at $7.0.
On the flip side, if SHIB fails to hold the support placed near the 0.382% Fibonacci Retracement of $3.6 then it will invalidate the bullish theses and open the gates for the lower levels. Investors could retest the swing lows of $2.56.
Technical Indicators:
RSI: The Daily Relative Strength Index (RSI) sliced below the average line to trade at 46. This indicates the selling pressure remains intact in the pair.
MACD: The Moving Average Convergence Divergence (MACD) trades neutral near the central line.


