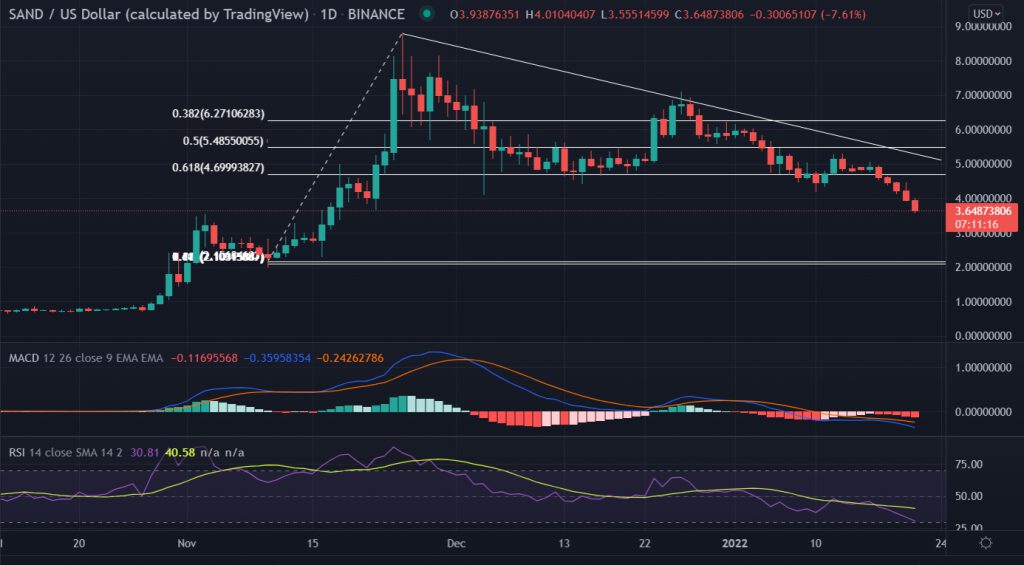
Sandbox (SAND) price remains under pressure on Friday, continuing the four-day fall. The price swing in between $5.48 and $4.6.Finally, the price has broken on January 17 with a total of a 28% decline. At the time of writing, the Sandbox price is trading at $3.68 with a 24-hour trading volume of $988,924,904.
- Sandbox price down almost 8% on Friday.
- Sellers seek correction below 0.618% Fibonacci retracement.
- The momentum oscillator remains in the oversold zone.
Metaverse token could be in trouble beyond $3.00
Sandbox price is in a clear downtrend from ATH made on November 25. Buyers failed to break the descending trend line on December 26. Bears are dominating the trend since then with the support of volumes. However, downside risk seems to be limited near the confluence zone of $3.60, this happens to be the horizontal support zone along with Fibonacci retracement.

On the weekly chart, the formation of a Doji candlestick formed on the second week of January followed by the next week’s big black candle suggests bears are in full control of the trade. The weekly Relative Strength Index (RSI), which trades near 52 indicates that prices might witness some upside momentum. But the receding MACD (Moving Average Convergence Divergence) rejects any upside theory for the pair.
Furthermore, the price is approaching toward the 20 DMA that is placed at $3.30. Next, if the psychological level near $3.0 is broken then gates will be open for the levels last seen at $2.0.
On the flip side, a daily close above $5.0, the horizontal resistance level can change the scenario for the bulls. Next, the market participants could take out December 26 highs of 7.10.


