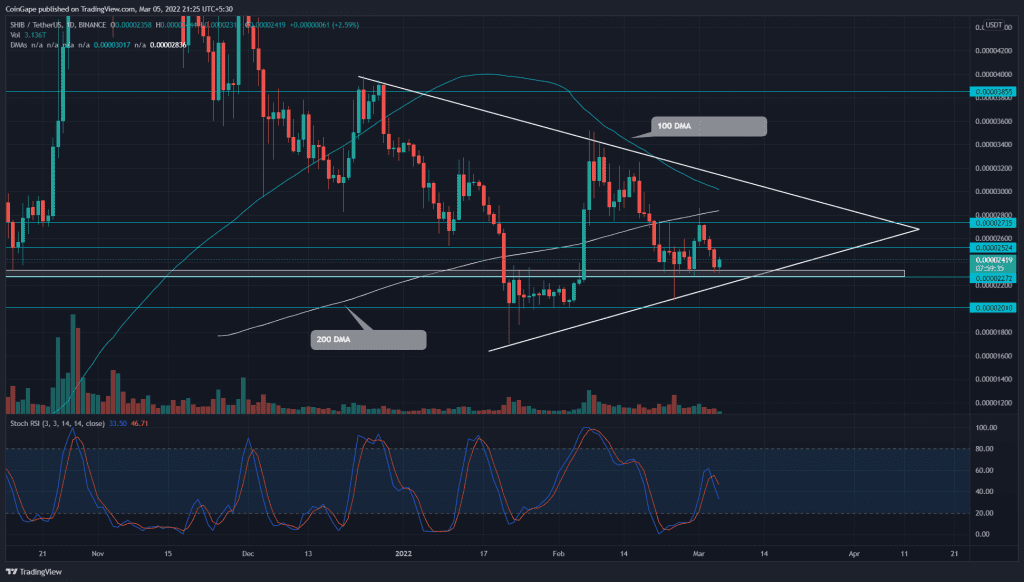
The range-bound movement in SHIB price has dropped to the support trendline of the symmetrical triangle pattern. The buyers preparing for a bullish reversal would face a steeper trendline before challenging the pattern’s key resistance.
Key technical points:
- The 200-day DMA has flipped to valid resistance
- The intraday trading volume in the Shiba Inu coin is $833.9 Million, indicating a 15.11% loss
Source- Tradingview
Over the past two months, the Shiba Inu(SHIB) has resonated in a symmetrical triangle pattern. The recent bull cycle from the $0.000002 support drove the price by 17.5%, reaching the immediate resistance at $0.0000027.
However, the buyers couldn’t overcome the shared resistance of $0.000027 and 200 DMA and sank the SHIB price back to bottom support(0.00002). The altcoin turns green today with a 5% gain, suggesting the buyers’ interest at this dip.
However, a bearish alignment among the downsloping crucial EMAs(20, 50, and 100) indicates the sellers have the upper hand. Moreover, the stochastic-RSI shows a bearish crossover among the K and D lines, projecting a sell signal.
SHIB price faces dynamic resistance from descending trendline

Source-tradingview
The recent fall showed three consecutive red candles backed by decreasing volume activity. This indicated weakness in the selling momentum and signaled a possible reversal from the bottom support($0.00002).
The altcoin will retest the steeper resistance trendline if the buyers bounce back from this support. A breakout and closing above this dynamic resistance would accelerate the buying pressure and spike the price to the pattern’s trendline.
On a contrary note, if sellers pull the SHIB price below $0.000022, the altcoin would retest the January low support at $0.00002.
- Resistance levels- $0.000025, and $0.000027
- Support levels are $0.000023 and $0.00002.


