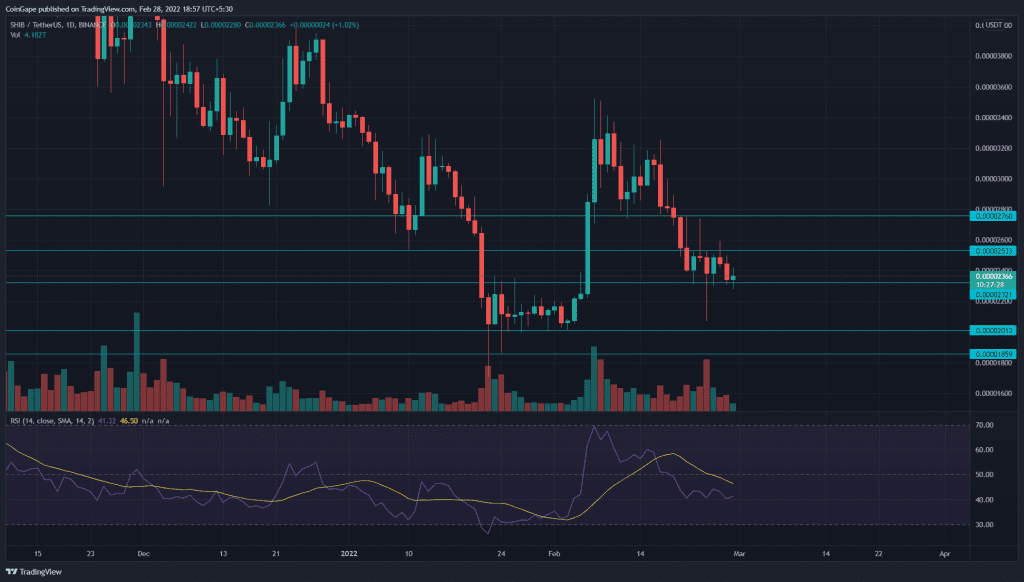
Russia-Ukraine negotiation news has put some ease on the crypto market. However, the Shiba Inu (SHIB) price resonates in a narrow consolidation over the past week, indicating no clear trend has been established The lower time frame chart shows a symmetrical triangle pattern which would kickstart a new recovery.
Key technical points:
- The 50-day EMA offer dynamic resistance to the SHIB price
- The intraday trading volume in the Shiba Inu coin is $1.2 Billion, indicating a 29% gain.
Source- Tradingview
The retracement rally began in February’s second week tumbled the Shib In(SHIB) price by 34%, hitting a prior resistance level of $0.0000232. The bears knocked out two significant support levels of $0.0000278 and $0.0000232.
Shiba Inu chart shows several lower price rejections at this level, indicating the resistance has flipped to support. However, the buyers are still struggling to overcome the immediate resistance of $0.0000253, creating a minor consolidation phase.
The sluggish movement of the daily RSI slope below the neutral zone maintains a negative sentiment among the traders.
SHIB Price Wobbling In A Symmetrical Triangle Pattern

Source-tradingview
The 4-hour technical chart displayed the above consolidation as a symmetrical triangle pattern. The SHIB price resonates inside this pattern preparing for its next move.
If buyers breakout and close above the descending trendline, the bulls would drive altcoin 12% high to reach the $0.000027 mark.
Alternatively, if sellers dump the price below the support trendline and $0.000023, the correction phase would continue, and the traders can expect to retest the January low support($0.0000186).
In a bearish alignment, the downsloping crucial EMAs(20, 50, 100, 200) indicate a downtrend. Moreover, the 4-hour 50 EMA dynamic resistance rejects the bear trend rallies.
- Resistance levels- $0.000025, and $0.000027
- Support levels are $0.000023 and $0.00002.


