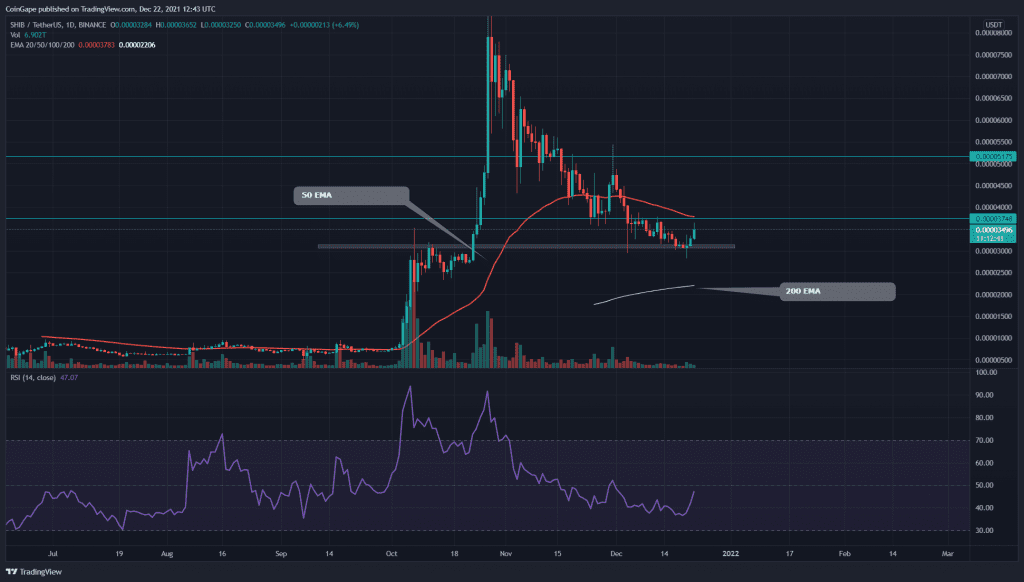
The correction phase that started in November last year took a significant toll on SHIB token prices. The pair lost 65% of its value and plunged to $0.000031 support. However, the price is obtaining decent demand pressure from the bottom support, suggesting an upcoming rally. Moreover, recent news for this token is that Australia’s longest-running crypto exchange, ‘CoinJar,’ will be listed Shiba Inu with six other coins.
Key technical points:
- The SHIB price crossing above the 20 and 100 EMA in the daily time frame chart
- The daily RSI line approaching the neutral line from below
- The 24-hour trading volume in the Shiba Inu coin is $1.56 Billion, indicating a 20.6% loss.
Source-Tradingview
As mentioned in my previous article on Shiba Inu, this pair plummeted to the crucial support of $0.000031 and entered a narrow consolidation. The token price has been resonating between $0.0000375 and this bottom support for more than three weeks.
On December 20, the coin price experienced intense selling pressure, which made a low of $0.00002885; however, the bulls stepped in and turned the price with a Doji-type candle by the end of the day. Furthermore, the coin shows a strong follow-up candle charging towards the overhead resistance of $0.00003775.
The SHIB token still price maintains a bullish trend as the price is trading above the 200 EMA. Moreover, the new rally is reclaiming the 20 and 100 EMA lines.
The daily Relative Strength Index (46) shows an impressive recovery similar to the price action. Its line could soon reach the middle line with the hope of bullish crossover.
SHIB/USD 4-hour time frame chart
Source- Tradingview
The SHIB token price shows a V-shaped recovery in this lower time frame chart. The token is currently trading at $0.0000348, indicating a 14% growth from lower support. Anyhow, the token still needs to breach and sustain above the $0.00003775 resistance, providing a better confirmation for a bull rally.
The Moving average convergence divergence indicator for the 4-hour chart shows the MACD (blue), and signal (orange) lines have recently crossover above the neutral zone, indicating a bullish momentum in the price.


