The dynamics support trendline stalled the ongoing correction rally at the $0.00002 support. The low volume activity near the support trendline suggests a considerable possibility of a bullish reversal. Today, the Shiba Inu(SHIB) trades at 0.000023, with an intraday gain of 0.7%.
Key points:
- The SHIB price retest the dynamic support trendline
- The 50-and-200-day EMA nearing a death crossover
- The intraday trading volume in Shiba Inu coin is $728.5 Million, indicating a 21% loss.
Source- Tradingview
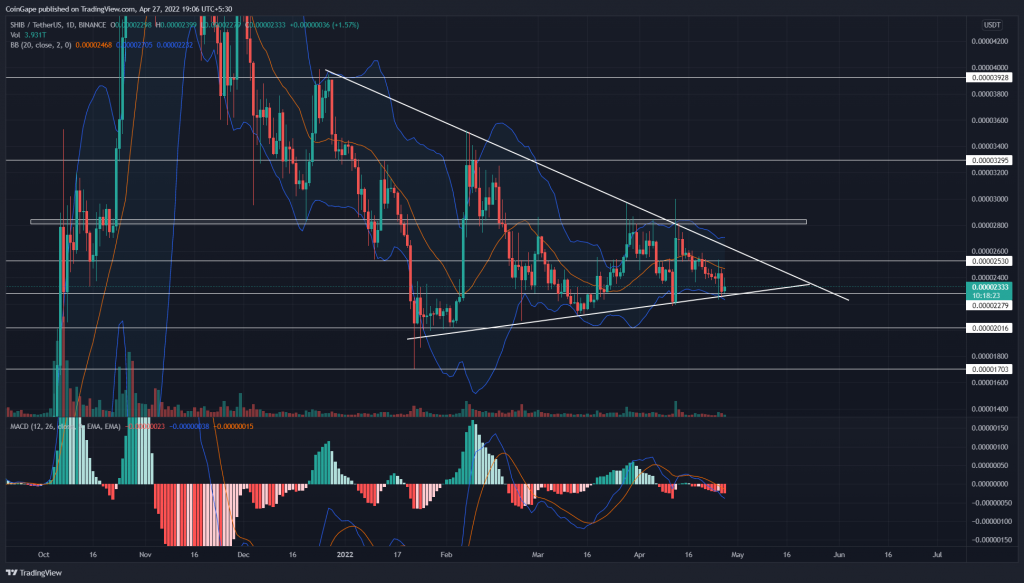
Over the past four months, the Shiba Inu(SHIB) price has maintained a series of higher lows and lower highs, reflecting a symmetrical triangle pattern. On April 14th, the SHIB price reverted from the $0.000028 resistance with an evening star pattern and plunged to $0.000023.
The bear cycle accounted for a 15% correction in the past two weeks and stabilized the coin at the dynamic support trendline. A possible reversal from this support would pump the SHIB price 12.5% higher to overhead resistance.
However, the price range gets narrower with each reversal, indicating the triangle breakout is near. Furthermore, the symmetrical triangle pattern possesses a dual side breakout possibility, and therefore, the traders must wait for the right signal.
Thus, a bullish breakout from the resistance trendline would drive the SHIB price to $0.00004. On the flip side, the support trendline breakdown could sink altcoin 23% lower to the $0.000017 mark.
Technical indicator
The Bollinger band indicator lines moving in tandem with the converging trendline accentuates the narrowing of the range. A genuine breakout on either trendline would also tag the Bollinger bands, offering an extra edge.
The MACD and signal line drops below the neutral line in a bearish sequence indicate sustained selling in the market.
- Resistance levels- $0.000025, and $0.000028
- Support levels are $0.0000228 and $0.00002


