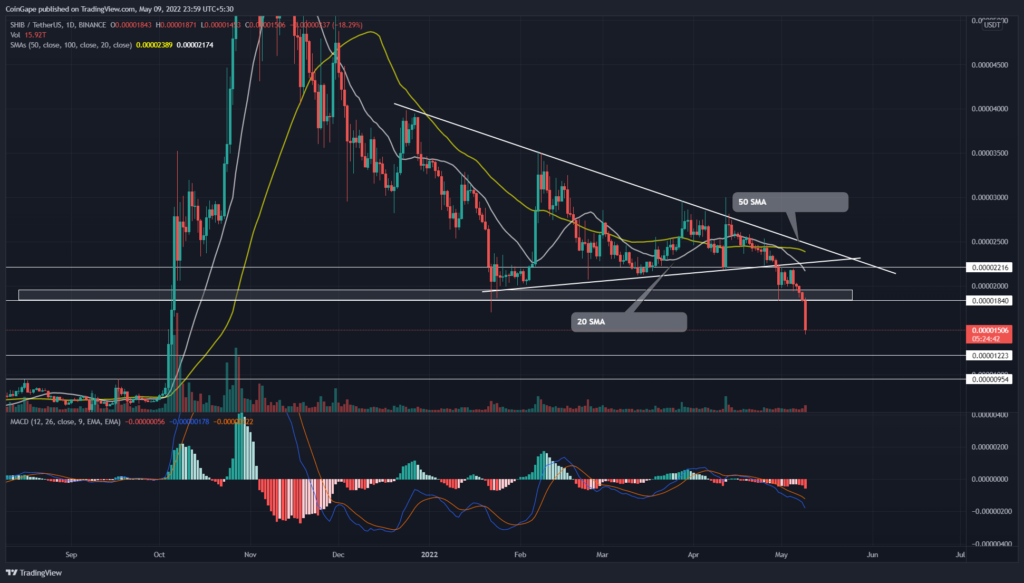
On April 30th, the Shiba Inu(SHIB) price gave a bearish breakdown from a symmetrical triangle pattern. Following a week of retest phase, the sellers showed sufficient sustainability below the breached support trendline and extended the downfall. The coin price breached the crucial $0.000018 support, suggesting a further decline to $0.000012 support.
Key points:
- SHIB price shows 32% in the last five days
- The SHIB price gives a decisive breakdown from $0.000018
- The intraday trading volume in Shiba Inu coin is $1.12 Billion, indicating a 86% hike.
Source- Tradingview
The four-month consolidation phase within the symmetrical triangle pattern ended in the sellers’ favor when the price gave a bearish breakdown from the support trendline. The triangle fallout released the trapped bearish bottom and continued the prevailing downtrend.
The post-retest fall reflected aggressive selling through five consecutive red candles, registering a 31% decline. Today, the SHIB price breached monthly support of the $0.000018 mark, with a 15% long bearish candle.
However, the SHIB price may revert to retest the breached support and validate the credibility of this breakdown. If the sellers sustain through the expected retest phase, the SHIB price will drop 22% lower to the $0.000012 mark.
Trending Stories
On a contrary note, a sudden spike in bullish momentum would drive the SHIB price above the $0.000018 mark, and the resulting fakeout would force liquidation of the trapped sellers. the resulting buy order would drive the coin price above $0.000022
Technical indicator
SMA– The sideways walk in the 50-and-100-day SMA accentuated the long consolidation in SHIB price. The declining 20-day SMA may offer immediate resistance during the bullish pullbacks.
MACD indicator: The MACD and the signal line extend the gap between them, indicating fast selling in the market. Moreover, the rising histogram chart displays rising bearish momentum.
- Resistance levels- $0.000018, and $0.000024
- Support levels are $0.0000122 and $0.00001


