SHIB price continues to consolidate in a short-term trading range with a negative bias. The current price action trades near a crucial support area waiting for a fresh trend set up. A successful breakout could yield gains for investors.
- SHIB price trades lower with a negative bias on Saturday.
- The bearish RSI divergence indicates impending downside movement.
- The downside risk is limited near the 50-day EMA.
As of press time, SHIB/USD reads at $0.000025, down 1.66% for the day. The 24-hour trading volume holds at $335,374,742 with a loss of 37%.
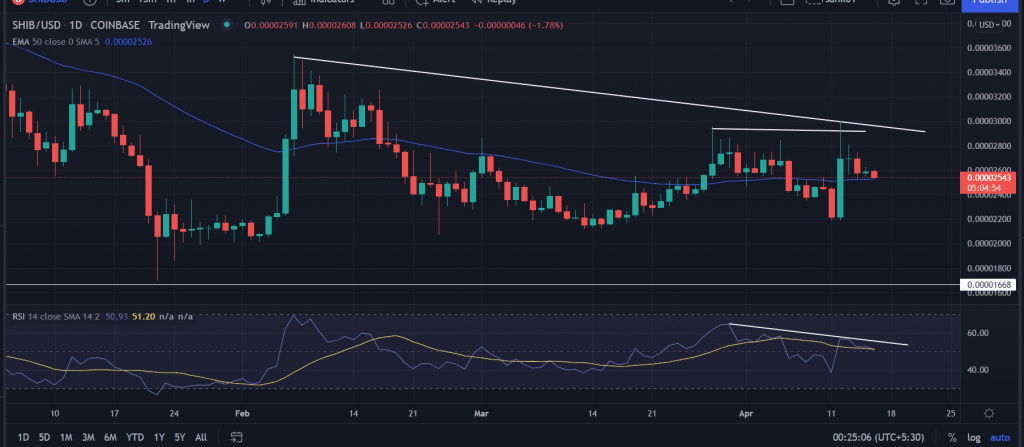
On the daily chart, the SHIB price remains pressured below the descending trend line, which is extending from the highs of $0.000035. The price attempted to test the bearish trend line on April 12 again at $0.000030. However, the bulls failed to carry forward the gains and retraced lower.
Now, the price hovers near the critical 50-day EMA (Exponential Moving Average) at $0.000025. A resurgence in the selling would slice the moving average to retest the lows of April 12 at $0.000021.
The daily relative strength index (RSI) gives a bearish divergence since March 30 while the price makes higher highs. The indicators read just above the average line hinting at the probable downside momentum.
Trending Stories
On the other hand, if the price is managed to close above the session’s high it would ignore the bullish outlook. A spike in the buy order could wold push the price toward the April 13 high at $0.000028.
An extended buying would further bring more gain towards the swing highs of $0.00030. This also coincides with the bearish slopping line. A daily close above the resistance barrier would reverse the current downside trend as will take out $0.32 with ease among sustained buying momentum.


