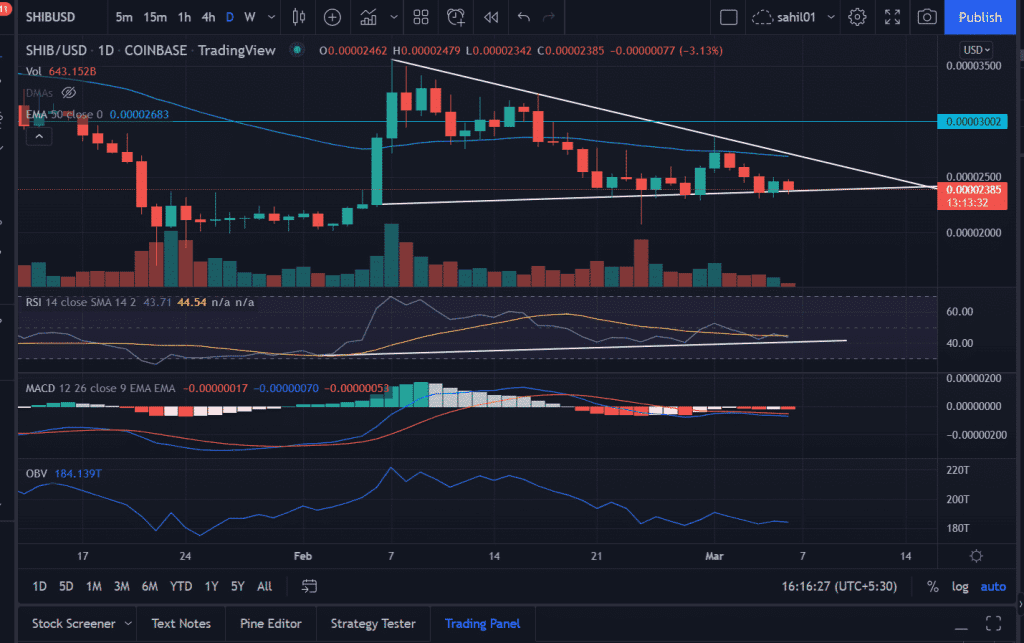
SHIBA (Inu) price is expected to trade higher as SHIB consolidates near the critical support zone at $0.000023. SHIB is looking for a breakout inside the ‘Symmetrical’ triangle formation as the price approaches the inflection point.
- SHIB trades with modest losses on Weekends.
- SHIB consolidates inside the ‘Symmetrical’ triangle with reliable support at $0.000023.
- Expect bulls to target 50-day EMA placed at $0.000026.
The volume supports the upside price momentum as can be seen on the daily chart. In today’s session, SHIB opened lower but quickly tested the lows around $0.000023 with above an average volume. In general, heightened volume with rising in price is a bullish sign.
Technical Indicators:
RSI: The daily Relative Strength Index (RSI) is trading at 45 with a neutral bias while hovering near the average line. The momentum indicator moves along the ascending trend line since February 4.
MACD: The Moving Average Convergence Divergence reads below the midline with increased bearish momentum.
Trading Volume: On Balance Volume (OBV) indicates consolidating volumes as to the price declines.
SHIB bulls will make an attempt to test the 50-day EMA (Exponential Moving Average) at $0.000026.
Furthermore, a decisive close above the upper trendline of the triangle could pave the wave for the horizontal resistance hurdle at $0.000030.
On the flip side, a lower break out of the ‘symmetrical triangle’ pattern would result in retesting of February lows at $0.000020. Next, market participants keep their eyes on lows made on January 22 at $0.000017.
SHIB price depreciated nearly 80% from record highs made on October 28 to the lows made in January. Since then SHIB rallied to swing highs of $0.000035 with increased buying pressure. But bulls lack the conviction to pass beyond the level.
As of publication, SHIB/USD is trading at $0.000023, down 3.07% for the day.


