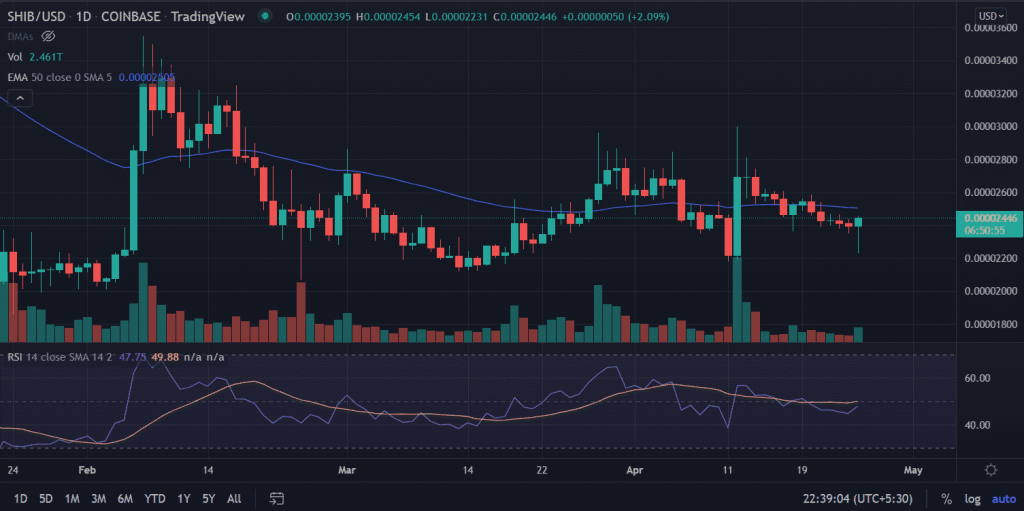
SHIB price started the session on a lower note but recovered sharply in the afternoon trade. An extended consolidation is seen on the technical chart that started in March. The accumulation of the token near $0.000022 pulls the demand as investors consider it a discount buying opportunity and hope for a strong up move in the price from here on.
- SHIB’s price remains in a long-term downtrend since October 2021 wherein it maintains strong support of $0.00002080.
- The formation of a bullish candlestick pattern on the daily chart suggests a bounce-back in the price in the short term.
- The recent downswing pushed SHIB towards a critical demand zone that could activate a new run-up.
SHIB price looks for reversal
On the daily chart, the recent price action made investors confused, who wants to make the money from the asset as wide fluctuation is being noticed. As SHIB swings from the highs of $0.000024 to test the low of $0.000022 delivering mixed signals throughout the day.
The formation of the “Dragonfly Doji” candlestick pattern on April 13 indicates the bulls are exhausted after the biggest single-day move since February 7, thus a reversal is on the offer. As a result for the last two weeks, the token dwindles near $0.0000020.
Now, the ‘Hammer’ candlestick formation, which is a bullish reversal pattern makes the bulls hopeful for a quick recovery in the price. The first upside filter could be found at the 50-day ema (Exponential Moving Average) at $0.000025.
Trending Stories
Next, the market participant would attempt to take out $0.000028.
On the contrary, a break below the session’s low would neglect the bullish arguments in the asset. In that case, the price would fall back to the lows on April 11 at $0.000024.
The Relative Strength Index (RSI) is oscillating at 47.
As of publication time, SHIB/USD is trading at $0.000024 up by 2.32%.


